Archive for March 2009

NSIDC: Arctic sea ice annual maximum extent for 2009 confirmed

March 30, 2009

NSIDC: 2009 annual maximum Arctic sea ice extent confirmed


Sign up for the RSS logo Arctic Sea Ice News RSS feed for automatic notification of analysis updates. Updates are also available via Twitter.

Arctic sea ice extent reached its maximum extent for the year, marking the beginning of the melt season. This year’s maximum was the fifth lowest in the satellite record. NSIDC will release a more detailed analysis of winter sea ice conditions during the second week of April.

map from space showing sea ice extent, continents 
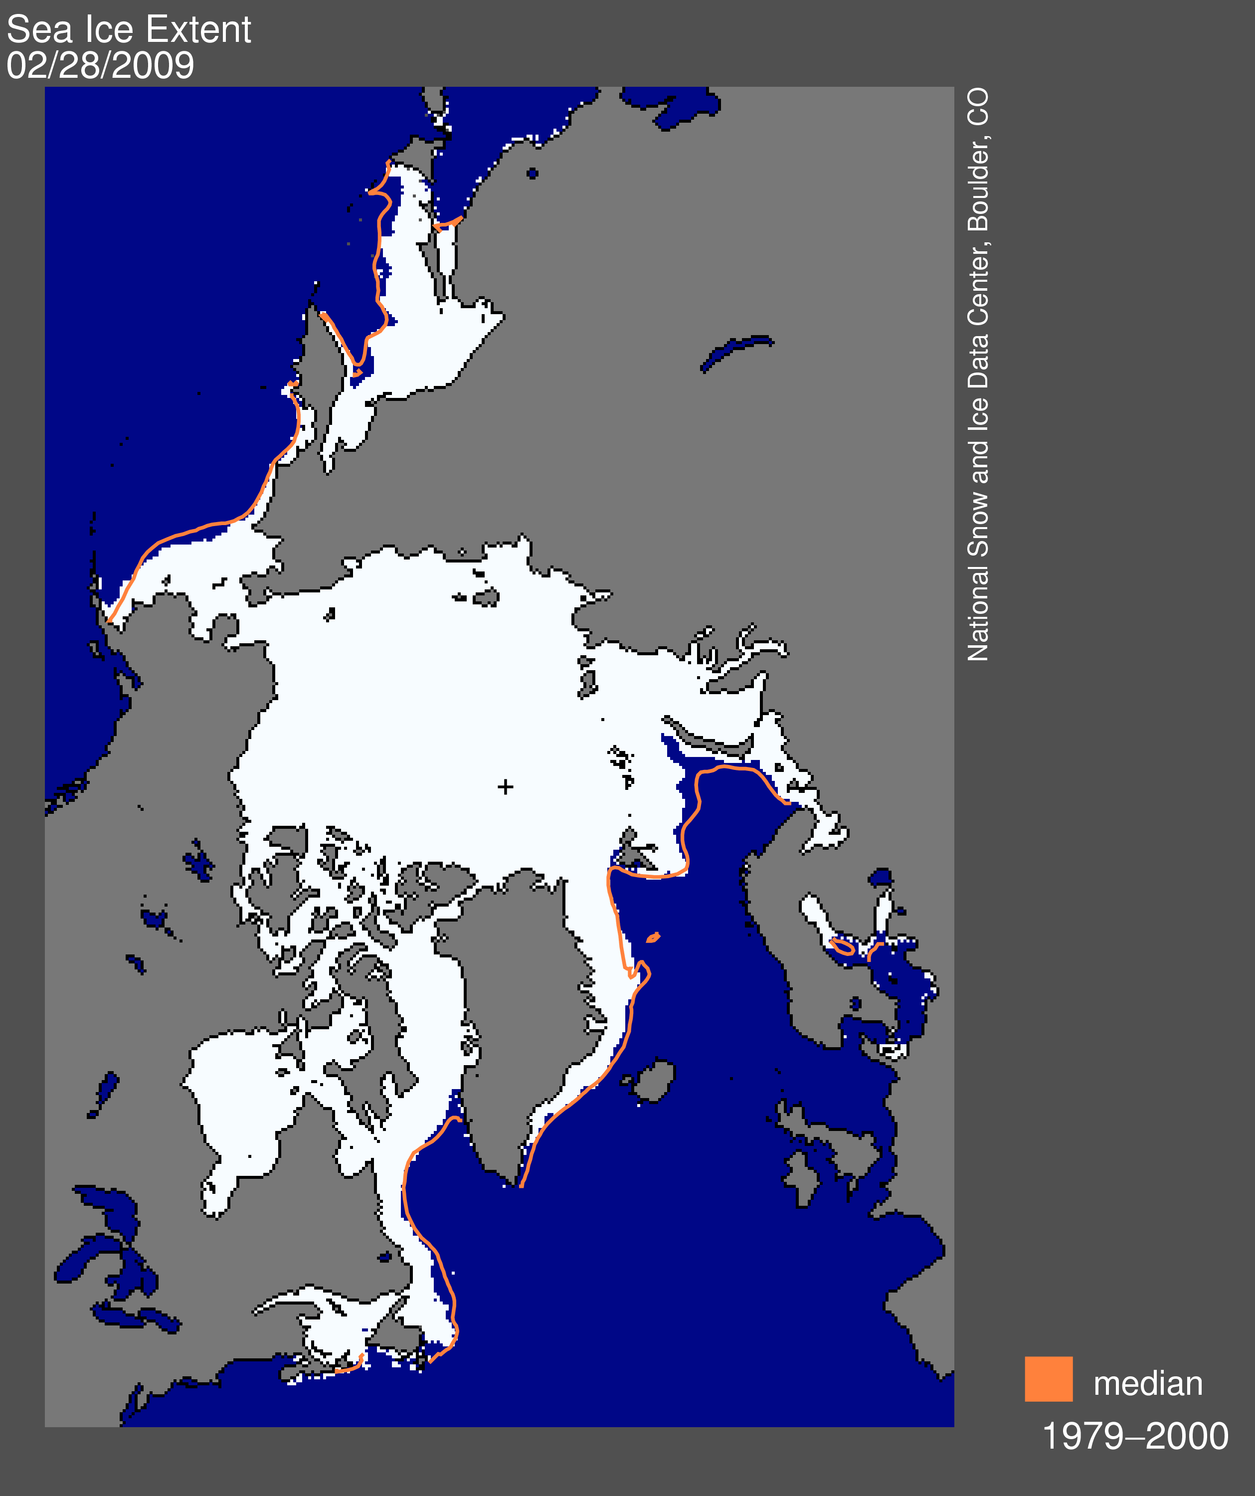
Figure 1. Arctic sea ice extent for February 28, 2009, the date of the annual maximum, was 15.14 million square kilometers (5.85 million square miles). The orange line shows the 1979 to 2000 median extent for that day. The black cross indicates the geographic North Pole. Sea Ice Index data. About the data. —Credit: National Snow and Ice Data Center

High-resolution image

Overview of conditions

On February 28, Arctic sea ice reached its maximum extent for the year, at 15.14 million square kilometers (5.85 million square miles). The maximum extent was 720,000 square kilometers (278,000 square miles) below the 1979 to 2000 average of 15.86 million square kilometers (6.12 million square miles), making it the fifth-lowest maximum extent in the satellite record. The six lowest maximum extents since 1979 have all occurred in the last six years (2004 to 2009).

graph with months on x axis and extent on y axis 
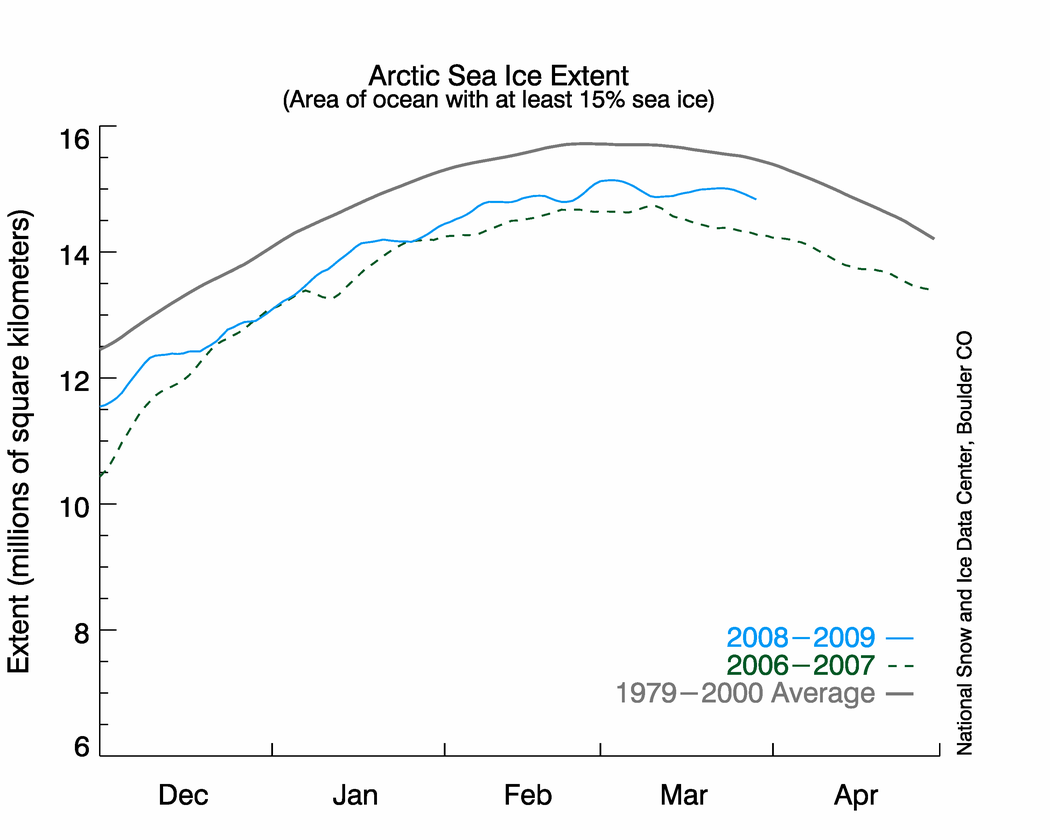
Figure 2. The graph above shows daily sea ice extent. The solid blue line indicates 2008 to 2009; the dashed green line shows 2006 to 2007 (the record-low summer minimum occurred in 2007); and the solid gray line indicates average extent from 1979 to 2000. Sea Ice Index data. —Credit: National Snow and Ice Data Center

High-resolution image

Conditions in context

In the beginning of March, ice extent began to decline, and it appeared that Arctic sea ice had reached its maximum extent. However, in the second week of March the ice edge began to expand again. Ice extent grew through much of the month of March, but it did not expand to the level seen on February 28.

Such ups and downs in Arctic sea ice extent are not unusual near the annual maximum. As discussed in our March 3 post, the ice edge at this time of year consists of thin ice that is sensitive to temperature changes, and easily redistributed by storm winds.

Link to NSIDC page: http://nsidc.org/arcticseaicenews/index.html

Ric Williams, North Atlantic Oscillation could be masking the overall effect of global warming in the North Atlantic Ocean

Wind patterns could mask effects of global warming in ocean

NOAA satellite image of a negative phase of the North Atlantic Oscillation. In this phase, the North Atlantic jet stream is shifted south of normal over the eastern U.S., and the upstream polar jet stream coming southward from Canada is stronger than normal. In contrast, the positive phase of the NAO features a northward shift of the North Atlantic jet stream pattern over the eastern U.S., and a reduced flow of cold air from Canada. (Credit: NOAA)

ScienceDaily (Feb. 15, 2008) — Scientists at the University of Liverpool have found that natural variability in the earth's atmosphere could be masking the overall effect of global warming in the North Atlantic Ocean.

Scientists have previously found that surface temperatures around the globe have risen over the last 30 years in accord with global warming. New data, however, shows that heat stored in the North Atlantic Ocean has a more complex pattern than initially expected, suggesting that natural changes in the atmosphere also play a role.

The Liverpool team, in collaboration with the University of Duke in the U.S., analysed 50 years of North Atlantic temperature records and used computer models to assess how the warming and cooling pattern was controlled. They found that the tropics and mid-latitudes have warmed, while the sub-polar regions have cooled.

Professor Ric Williams, from the University's School of Earth and Ocean Sciences, explains: "We found that changes in the heat stored in the North Atlantic corresponded to changes in natural and cyclical winds above the North Atlantic. This pattern of wind movement is called the North Atlantic Oscillation (NAO), which is linked to pressure differences in the atmosphere between Iceland and The Azores.

"The computer model we used to analyse our data helped us to predict how wind and heat exchange with the atmosphere affects the North Atlantic Ocean's heat content over time. We found that the warming over the mid latitudes was due to the wind redistributing heat, while the gain in heat in the tropics and loss in heat at high latitudes was due to an exchange of heat with the atmosphere.

"These local changes in heat storage are typically 10 times larger than any global warming trend. We now need to look at why changes are occurring in wind circulation, as this in itself could be linked to global warming effects."

Although natural variability appears to be masking global warming effects in the ocean, scientists still believe that global warming is occurring, as evident through a wide range of independent signals such as rising surface and atmospheric temperatures, reduced Arctic summer sea ice and the reduced extent of many glaciers showing changes in the environment.

The research is published in Science. This study was jointly supported by the UK Natural Environment Research Council (NERC) and the US National Science Foundation.

Link to article: http://www.sciencedaily.com/releases/2008/02/080207101333.htm

T. Mochizuki, T. Awaji, N. Sugiura, GRL, 36, Possible oceanic feedback in the extratropics in relation to the North Atlantic SST tripole

Geophysical Research Letters, 36, L05710; doi:10.1029/2008GL036781

Possible oceanic feedback in the extratropics in relation to the North Atlantic SST tripole

Takashi Mochizuki (Frontier Research Center for Global Change, JAMSTEC, Yokohama, Japan), Toshiyuki Awaji (Frontier Research Center for Global Change, JAMSTEC, Yokohama, and Department of Geophysics, Kyoto University, Kyoto, Japan), and Nozomi Sugiura (Frontier Research Center for Global Change, JAMSTEC, Yokohama, Japan)

Abstract

We analyze the results of 4-dimensional variational data assimilation experiments using a coupled general circulation model and identify signals from a possible extratropical oceanic feedback relating to the North Atlantic Sea Surface Temperature (SST) tripole. Examination of the optimized control variables (coupling parameters) and the resultant climate fields reveals that the model errors in the North Atlantic climate variations are very sensitive to the intensity of the extratropical air-sea thermal coupling. This results in the enhancement of the atmospheric responses to SST changes particularly around 40°N, 50°W, when the model errors are most effectively corrected. Since an adjoint approach enables us to detect the sensitivity to fluctuations in the model variables, our results suggest that this oceanic thermal feedback in the extratropics is a key physical process influencing the North Atlantic Oscillation and the associated North Atlantic SST tripole.

Received 24 November 2008, accepted 10 February 2009, published 14 March 2009.

Mochizuki, T., T. Awaji, & N. Sugiura (2009), Possible oceanic feedback in the extratropics in relation to the North Atlantic SST tripole, Geophys. Res. Lett., 36, L05710; doi:10.1029/2008GL036781.

Link to abstract: http://www.agu.org/pubs/crossref/2009/2008GL036781.shtml

Takashi Mochizuki et al., Understanding sea temperature-atmospheric pressure links in the North Atlantic (SST anomaly tripole)

Understanding sea temperature-atmospheric pressure links in the North Atlantic

ScienceDaily (Mar. 29, 2009) — Feedback effects between the ocean and atmosphere are important to understanding the mechanisms affecting climate variations.

Previous studies have found that atmospheric anomalies associated with a variation in atmospheric pressure above the North Atlantic Ocean called the North Atlantic Oscillation produce a three-part pattern (tripole) of sea surface temperature anomalies at midlatitudes. Scientists refer to such anomalies as the North Atlantic sea surface temperature tripole, and scientists have debated to what extent the atmosphere responds to these midlatitude sea surface temperature variations.

Reporting in the journal Geophysical Research Letters, Mochizuki et al. identify oceanic feedback signals poleward of the tropics, taking a new approach based on a model used in four-dimensional variational data assimilation to determine the sensitivity of the model to fluctuations in physical variables.

Their results reveal that oceanic thermal feedback beyond the tropics is an important process influencing the North Atlantic Oscillation, providing a better understanding of the factors affecting climate variations in the North Atlantic.

The authors include: Takashi Mochizuki, Toshiyuki Awaji, and Nozomi Sugiura: Frontier Research Center for Global Change, JAMSTEC, Yokohama, Japan; Awaji is also at Department of Geophysics, Kyoto University, Kyoto, Japan.

Mochizuki et al. Possible oceanic feedback in the extratropics in relation to the North Atlantic SST tripole. Geophysical Research Letters, 2009, 36 (5), L05710; DOI: 10.1029/2008GL036781

Link to article: http://www.sciencedaily.com/releases/2009/03/090325155634.htm

Van Jones, Power Shift '09, author of "The Green Collar Economy"


Van Jones, author of "The Green Collar Economy," gives the keynote speech at PowerShift '09.

Link to this YouTube video: http://www.youtube.com/watch?v=xlOv8RCkcXE

Thomas Friedman: Mother Nature’s Dow

Mother Nature’s Dow

New York Times, March 28, 2009

While I’m convinced that our current financial crisis is the product of both The Market and Mother Nature hitting the wall at once — telling us we need to grow in more sustainable ways — some might ask this: We know when the market hits a wall. It shows up in red numbers on the Dow. But Mother Nature doesn’t have a Dow. What makes you think she’s hitting a wall, too? And even if she is: Who cares? When my 401(k) is collapsing, it’s hard to worry about my sea level rising.

Thomas L. Friedman . Photo Fred R. Conrad/The New York Times

It’s true, Mother Nature doesn’t tell us with one simple number how she’s feeling. But if you follow climate science, what has been striking is how insistently some of the world’s best scientists have been warning — in just the past few months — that climate change is happening faster and will bring bigger changes quicker than we anticipated just a few years ago. Indeed, if Mother Nature had a Dow, you could say that it, too, has been breaking into new (scientific) lows.

Consider just two recent articles:

The Washington Post reported on Feb. 1, that “the pace of global warming is likely to be much faster than recent predictions, because industrial greenhouse gas emissions have increased more quickly than expected and higher temperatures are triggering self-reinforcing feedback mechanisms in global ecosystems, scientists said. ‘We are basically looking now at a future climate that’s beyond anything we’ve considered seriously in climate model simulations,’ Christopher Field, director of the Carnegie Institution’s Department of Global Ecology at Stanford University, said.”

The physicist and climate expert Joe Romm recently noted on his blog, climateprogress.org, that in January, M.I.T.’s Joint Program on the Science and Policy of Global Change quietly updated its Integrated Global System Model that tracks and predicts climate change from 1861 to 2100. Its revised projection indicates that if we stick with business as usual, in terms of carbon-dioxide emissions, average surface temperatures on Earth by 2100 will hit levels far beyond anything humans have ever experienced.

“In our more recent global model simulations,” explained M.I.T., “the ocean heat-uptake is slower than previously estimated, the ocean uptake of carbon is weaker, feedbacks from the land system as temperature rises are stronger, cumulative emissions of greenhouse gases over the century are higher, and offsetting cooling from aerosol emissions is lower. Not one of these effects is very strong on its own, and even adding each separately together would not fully explain the higher temperatures. [But,] rather than interacting additively, these different effects appear to interact multiplicatively, with feedbacks among the contributing factors, leading to the surprisingly large increase in the chance of much higher temperatures.”

What to do? It would be nice to say, “Hey, Mother Nature, we’re having a credit crisis, could you take a couple years off?” But as the environmental consultant Rob Watson likes to say, “Mother Nature is just chemistry, biology and physics,” and she is going to do whatever they dictate. You can’t sweet talk Mother Nature or the market. You have to change the economics to affect the Dow and the chemistry, biology and physics to affect Mother Nature.

That’s why we need a climate bailout along with our economic bailout. Hal Harvey is the C.E.O. of a new $1 billion foundation, ClimateWorks, set up to accelerate the policy changes that can avoid climate catastrophe by taking climate policies from where they are working the best to the places where they are needed the most.

“There are five policies that can help us win the energy-climate battle, and each has been proven somewhere,” Harvey explained. First, building codes: California’s energy-efficient building and appliance codes now save Californians $6 billion per year,” he said. Second, better vehicle fuel-efficiency standards: “The European Union’s fuel-efficiency fleet average for new cars now stands at 41 miles per gallon, and is rising steadily,” he added.

Third, we need a national renewable portfolio standard, mandating that power utilities produce 15 or 20 percent of their energy from renewables by 2020. Right now, only about half our states have these. “Whenever utilities are required to purchase electricity from renewable sources,” said Harvey, “clean energy booms.” (See Germany’s solar business or Texas’s wind power.)

The fourth is decoupling — the program begun in California that turns the utility business on its head. Under decoupling, power utilities make money by helping homeowners save energy rather than by encouraging them to consume it. “Finally,” said Harvey, “we need a price on carbon.” Polluting the atmosphere can’t be free.

These are the pillars of a climate bailout. Yes, some have upfront costs. But all of them would pay long-term dividends, because they would foster massive U.S. innovation in new clean technologies that would stimulate the real Dow and much lower emissions that would stimulate the Climate Dow.

Link to article: http://www.nytimes.com/2009/03/29/opinion/29friedman.html

Chinese government spy system invades Dalai Lama's computers and others in 103 countries, also listens in on Skype

Readers, please take notice of how this works:

Infection happens two ways. In one method, a user’s clicking on a document attached to an e-mail message lets the system covertly install software deep in the target operating system. Alternatively, a user clicks on a Web link in an e-mail message and is taken directly to a “poisoned” Web site.

Vast Spy System Loots Computers in 103 Countries

The New York Times, March 28, 2009

TORONTO — A vast electronic spying operation has infiltrated computers and has stolen documents from hundreds of government and private offices around the world, including those of the Dalai Lama, Canadian researchers have concluded.

Tim Leyes for The New York Times

The Toronto academic researchers who are reporting on the spying operation dubbed GhostNet include, from left, Ronald J. Deibert, Greg Walton, Nart Villeneuve and Rafal A. Rohozinski.

Readers' Comments

In a report to be issued this weekend, the researchers said that the system was being controlled from computers based almost exclusively in China, but that they could not say conclusively that the Chinese government was involved.

The researchers, who are based at the Munk Center for International Studies at the University of Toronto, had been asked by the office of the Dalai Lama, the exiled Tibetan leader whom China regularly denounces, to examine its computers for signs of malicious software, or malware.

Their sleuthing opened a window into a broader operation that, in less than two years, has infiltrated at least 1,295 computers in 103 countries, including many belonging to embassies, foreign ministries and other government offices, as well as the Dalai Lama’s Tibetan exile centers in India, Brussels, London and New York.

The researchers, who have a record of detecting computer espionage, said they believed that in addition to the spying on the Dalai Lama, the system, which they called GhostNet, was focused on the governments of South Asian and Southeast Asian countries.

Intelligence analysts say many governments, including those of China, Russia and the United States, and other parties use sophisticated computer programs to covertly gather information.

The newly reported spying operation is by far the largest to come to light in terms of countries affected.

This is also believed to be the first time researchers have been able to expose the workings of a computer system used in an intrusion of this magnitude.

Still going strong, the operation continues to invade and monitor more than a dozen new computers a week, the researchers said in their report, “Tracking ‘GhostNet’: Investigating a Cyber Espionage Network.” They said they had found no evidence that United States government offices had been infiltrated, although a NATO computer was monitored by the spies for half a day and computers of the Indian Embassy in Washington were infiltrated.

The malware is remarkable both for its sweep — in computer jargon, it has not been merely “phishing” for random consumers’ information, but “whaling” for particular important targets — and for its Big Brother-style capacities. It can, for example, turn on the camera and audio-recording functions of an infected computer, enabling monitors to see and hear what goes on in a room. The investigators say they do not know if this facet has been employed.

The researchers were able to monitor the commands given to infected computers and to see the names of documents retrieved by the spies, but in most cases the contents of the stolen files have not been determined. Working with the Tibetans, however, the researchers found that specific correspondence had been stolen and that the intruders had gained control of the electronic mail server computers of the Dalai Lama’s organization.

The electronic spy game has had at least some real-world impact, they said. For example, they said, after an e-mail invitation was sent by the Dalai Lama’s office to a foreign diplomat, the Chinese government made a call to the diplomat discouraging a visit. And a woman working for a group making Internet contacts between Tibetan exiles and Chinese citizens was stopped by Chinese intelligence officers on her way back to Tibet, shown transcripts of her online conversations and warned to stop her political activities.

The Toronto researchers said they had notified international law enforcement agencies of the spying operation, which in their view exposed basic shortcomings in the legal structure of cyberspace. The F.B.I. declined to comment on the operation.

Although the Canadian researchers said that most of the computers behind the spying were in China, they cautioned against concluding that China’s government was involved. The spying could be a nonstate, for-profit operation, for example, or one run by private citizens in China known as “patriotic hackers.”

“We’re a bit more careful about it, knowing the nuance of what happens in the subterranean realms,” said Ronald J. Deibert, a member of the research group and an associate professor of political science at Munk. “This could well be the C.I.A. or the Russians. It’s a murky realm that we’re lifting the lid on.”

A spokesman for the Chinese Consulate in New York dismissed the idea that China was involved. “These are old stories and they are nonsense,” the spokesman, Wenqi Gao, said. “The Chinese government is opposed to and strictly forbids any cybercrime.”

The Toronto researchers, who allowed a reporter for The New York Times to review the spies’ digital tracks, are publishing their findings in Information Warfare Monitor, an online publication associated with the Munk Center.

At the same time, two computer researchers at Cambridge University in Britain who worked on the part of the investigation related to the Tibetans, are releasing an independent report. They do fault China, and they warned that other hackers could adopt the tactics used in the malware operation.

“What Chinese spooks did in 2008, Russian crooks will do in 2010 and even low-budget criminals from less developed countries will follow in due course,” the Cambridge researchers, Shishir Nagaraja and Ross Anderson, wrote in their report, “The Snooping Dragon: Social Malware Surveillance of the Tibetan Movement.”

In any case, it was suspicions of Chinese interference that led to the discovery of the spy operation. Last summer, the office of the Dalai Lama invited two specialists to India to audit computers used by the Dalai Lama’s organization. The specialists, Greg Walton, the editor of Information Warfare Monitor, and Mr. Nagaraja, a network security expert, found that the computers had indeed been infected and that intruders had stolen files from personal computers serving several Tibetan exile groups.

Back in Toronto, Mr. Walton shared data with colleagues at the Munk Center’s computer lab.

One of them was Nart Villeneuve, 34, a graduate student and self-taught “white hat” hacker with dazzling technical skills. Last year, Mr. Villeneuve linked the Chinese version of the Skype communications service to a Chinese government operation that was systematically eavesdropping on users’ instant-messaging sessions.

Early this month, Mr. Villeneuve noticed an odd string of 22 characters embedded in files created by the malicious software and searched for it with Google. It led him to a group of computers on Hainan Island, off China, and to a Web site that would prove to be critically important.

In a puzzling security lapse, the Web page that Mr. Villeneuve found was not protected by a password, while much of the rest of the system uses encryption.

Mr. Villeneuve and his colleagues figured out how the operation worked by commanding it to infect a system in their computer lab in Toronto. On March 12, the spies took their own bait. Mr. Villeneuve watched a brief series of commands flicker on his computer screen as someone — presumably in China — rummaged through the files. Finding nothing of interest, the intruder soon disappeared.

Through trial and error, the researchers learned to use the system’s Chinese-language “dashboard” — a control panel reachable with a standard Web browser — by which one could manipulate the more than 1,200 computers worldwide that had by then been infected.

Infection happens two ways. In one method, a user’s clicking on a document attached to an e-mail message lets the system covertly install software deep in the target operating system. Alternatively, a user clicks on a Web link in an e-mail message and is taken directly to a “poisoned” Web site.

The researchers said they avoided breaking any laws during three weeks of monitoring and extensively experimenting with the system’s unprotected software control panel. They provided, among other information, a log of compromised computers dating to May 22, 2007.

They found that three of the four control servers were in different provinces in China — Hainan, Guangdong and Sichuan — while the fourth was discovered to be at a Web-hosting company based in Southern California.

Beyond that, said Rafal A. Rohozinski, one of the investigators, “attribution is difficult because there is no agreed upon international legal framework for being able to pursue investigations down to their logical conclusion, which is highly local.”

Link to article: http://www.nytimes.com/2009/03/29/technology/29spy.html

James Hansen's comments on the New York Times Magazine article "The Civil Heretic" on Dyson Freeman


The one page attachment consists of the following note (sorry to have caused the need for this by my sloppy response to a reporter).

New York Times Magazine

Tomorrow’s NY Times Magazine article (The Civil Heretic) on Freeman Dyson includes an unfortunate quote from me that may appear to be disparaging and ad hominem (something about bigger fish to fry). It was a quick response to a reporter* who had been doggedly pursuing me for an interview that I did not want to give. I accept responsibility for the sloppy wording and I will apologize to Freeman, who deserves much respect.

You might guess (correctly) that I was referring to the fact that contrarians are not the real problem – it is the vested interests who take advantage of the existence of contrarians.

There is nothing wrong with having contrarian views, even from those who have little relevant expertise – indeed, good science continually questions assumptions and conclusions. But the government needs to get its advice from the most authoritative sources, not from magazine articles. In the United States the most authoritative source of information would be the National Academy of Sciences.

The fact that the current administration in the United States has not asked for such advice, when combined with continued emanations about “cap and trade”, should be a source of great concern. What I learned in visiting other countries is that most governments do not want to hear from their equivalent scientific bodies, probably because they fear the advice will be “stop building coal plants now!” These governments are all guilty of greenwash, pretending that they are dealing with the climate problem via “goals” and “caps”, while they continue to build coal plants and even investigate unconventional fossil fuels and coal-to-liquids.

I will send out something (“Worshiping the Temple of Doom”) on cap-and-trade soon. It is incredible how governments resist the obvious (maybe not so incredible when lobbying budgets are examined, along with Washington’s revolving doors). This is not rocket science. If we want to move toward energy independence and solve the climate problem, we need to stop subsidizing fossil fuels with the public’s money and instead place a price on carbon emissions.

My suggestion is Carbon Fee and 100% Dividend, with a meaningful starting price (on oil, gas and coal at the mine or port of entry) equivalent to $1/gallon gasoline ($115/ton CO2). Based on 2007 fuel use, this would generate $670B/year – returned 100% to the public (monthly electronic deposit in bank accounts or debit cards), the dividend would be $3000 per adult legal resident, $9000/year per family with two or more children. This is large enough to affect consumer product and life style choices, investments and innovations. Of course all the other things (rules re vehicle, appliance and building efficiencies, smart electric grid, utility profit motives, etc.) are needed, but a rising carbon price is needed to make them work and move us most efficiently to the cleaner world beyond fossil fuels.


* The reporter left the impression that my conclusions are based mainly on climate models. I always try to make clear that our conclusions are based on #1 Earth’s history, how it responded to forcings in the past, #2 observations of what is happening now, #3 models. Here is the actual note that I sent to the reporter after hanging up on him:

I looked up Freeman Dyson on Wikipedia, which describes his views on "global warming" as below. If that is an accurate description of what he is saying now, it is actually quite reasonable (I had heard that he is just another contrarian). However, this also indicates that he is under the mistaken impression that concern about global warming is based on climate models, which in reality play little role in our understanding -- our understanding is based mainly on how the Earth responded to changes of boundary conditions in the past and on how it is responding to on-going changes.
If this Wikipedia information is an accurate description of his position, then the only thing that I would like to say about him is that he should be careful not to offer public opinions about global warming unless he is willing to first take a serious look at the science. His philosophy of science is spot-on, the open-mindedness, consistent with that of Feynman and the other greats, but if he is going to wander into something with major consequences for humanity and other life on the planet, then he should first do his homework -- which he obviously has not done on global warming. My concern is that the public may assume that he has -- and, because of his other accomplishments, give his opinion more weight than it deserves.

Jim Hansen

Link to pdf file: [will be added later]

"Dr. Hansen periodically posts commentary on his recent papers and presentations and on other topics of interest to an e-mail list. To be added to the list distribution, please e-mail hansencu@gmail.com with "ADD" as the subject of your message." See here: http://www.columbia.edu/~jeh1/

Australia, citing national security, blocks state-owned China Minmetals Corporation's takeover of OZ Minerals

Australia Blocks China’s Purchase of Mining Company

by Bettina Wassener, New York Times, March 27, 2009

HONG KONG — Citing national security, Australia on Friday blocked one of several acquisitions China is seeking in the country’s natural resources sector, a move that may stoke concerns about rising protectionist tendencies around the globe.

The decision to block the purchase of OZ Minerals, a mining company, by state-owned China Minmetals Corporation, coincides with a heated debate concerning a much larger investment that the Chinese metals company Chinalco is planning to make in the British-Australian mining group Rio Tinto.

It also comes two weeks after Chinese anti-trust authorities blocked a move by Coca-Cola to take over Huiyuan Juice Group, a Chinese juice manufacturer, for $2.4 billion — a decision that caused widespread concern about China’s attitude to foreign takeovers of local companies.

Australia’s treasurer, Wayne Swan, said on Friday that he decided to block the OZ Minerals transaction was because the company’s Prominent Hill gold and copper mine, its core asset, is near a sensitive defense facility.

“The government has determined that Minmetals’ proposal for OZ Minerals cannot be approved if it includes Prominent Hill,” Mr. Swan said in a statement.

He added that discussions were continuing “in relation to OZ Minerals’ other businesses and assets, and the government is willing to consider alternative proposals relating to those other assets and businesses.”

The chief executive of OZ Minerals, Andrew Michelmore, said the company and Minmetals were discussing potential changes to the deal and would make an announcement “as soon as possible.”

Battered by falling earnings as raw materials have plunged in line with the slowing global economy, both OZ Minerals and Rio urgently need the cash injection that the Chinese companies’ investments represent.

OZ Minerals is scheduled to repay more than $900 million in debt next week, and must now renegotiate the deal or obtain a loan extension.

Analysts on Friday said it was unclear whether Minmetals would proceed without Prominent Hill, which is considered a core asset.

In a statement issued in Australia, Minmetals said Friday it wanted to continue talks: “Our focus is on delivering an agreed solution to OZ Minerals that meets national interests, can satisfy lenders, deliver stability to employees and protect existing operations.”

Whatever happens, Friday’s announcement will fuel the debate about a rise in global protectionism — even if Canberra’s rejection was due to security concerns rather than business protectionism.

A recent flurry of bids for some of Australia’s most prized natural resource assets has caused public and political unease in the country, as well as, in the case of the proposed Chinalco transaction with Rio, angry protests from shareholders.

At the same time, however, China is the main buyer of the natural resources that form the bedrock of Australia’s economy, making the approval of such deals politically sensitive.

Chinalco, or Aluminum Corporation of China, as it is officially known, last month proposed investing $19.5 billion in the miner. That deal, currently being evaluated by Australia’s anti-trust authorities, would be the biggest foreign investment to date by a Chinese company and increase its leverage in pricing negotiations for iron ore from Rio’s mines.

The attempted OZ Minerals takeover, and a separate bid by the Chinese steel manufacturer Hunan Valin Iron for a 17.5% stake in Fortescue Metals Group, another Australian company, are much smaller — $1.7 billion in the case of OZ Minerals.

But all three transactions, each announced in the last few months, reveal China’s desire to take advantage of the recent drop in commodities prices to secure its hold over natural resources.

Link to article: http://www.nytimes.com/2009/03/28/business/worldbusiness/28mine.html

Gavin Schmidt of Real Climate shows how Patrick Michaels' testimony and graph purporting to show abject failure of climate models were pure lies

26 March 2009

Michaels’ new graph

— gavin @ 4:34 PM

Every so often people who are determined to prove a particular point will come up with a new way to demonstrate it. This new methodology can initially seem compelling, but if the conclusion is at odds with other more standard ways of looking at the same question, further investigation can often reveal some hidden dependencies or non-robustness. And so it is with the new graph being cited purporting to show that the models are an "abject" failure.


The figure in question was first revealed in Michaels' recent testimony to Congress:

The idea is that you calculate the trends in the observations to 2008 starting in 2003, 2002, 2001…. etc, and compare that to the model projections for the same period. Nothing wrong with this in principle. However, while it initially looks like each of the points is bolstering the case that the real world seems to be tracking the lower edge of the model curve, these points are not all independent. For short trends, there is significant impact from the end points, and since each trend ends on the same point (2008), an outlier there can skew all the points significantly. An obvious question then is how does this picture change year by year? or if you use a different data set for the temperatures? or what might it look like in a year's time? Fortunately, this is not rocket science, and so the answers can be swiftly revealed.

First off, this is what you would have got if you'd done this last year:

which might explain why it never came up before. I've plotted both the envelope of all the model runs I'm using and 2 standard deviations from the mean. Michaels appears to be using a slightly different methodology that involves grouping the runs from a single model together before calculating the 95% bounds. Depending on the details that might or might not be appropriate - for instance, averaging the runs and calculating the trends from the ensemble means would incorrectly reduce the size of the envelope, but weighting the contribution of each run to the mean and variance by the number of model runs might be ok.

Of course, even using the latest data (up to the end of 2008), the impression one gets depends very much on the dataset you are using:

More interesting perhaps is what it will likely look like next year once 2009 has run its course. I made two different assumptions -- that this year will be the same as last year (2008), or that it will be the same as 2007. These two assumptions bracket the result you get if you simply assume that 2009 will equal the mean of the previous 10 years. Which of these assumptions is most reasonable remains to be seen, but the first few months of 2009 are running significantly warmer than 2008. Nonetheless, it's easy to see how sensitive the impression being given is to the last point and the dataset used.

It is thus unlikely this new graph would have seen the light of day had it come up in 2007; and given that next year will likely be warmer than last year, it is not likely to come up again; and since the impression of 'failure' relies on you using the HadCRUT3v data, we probably won't be seeing too many sensitivity studies either.

To summarise, initially compelling pictures whose character depends on a single year's worth of data and only if you use a very specific dataset are unlikely to be robust or provide much guidance for future projections. Instead, this methodology tells us a) that 2008 was relatively cool compared to recent years and b) short term trends don't tell you very much about longer term ones. Both things we knew already.

Next.

Link to Real Climate: http://www.realclimate.org/index.php/archives/2009/03/michaels-new-graph/

With all due respect… -- Real Climate on the Cato Institute's and Patrick Michaels' latest scam

Real Climate on the Cato Institute's and Patrick Michaels' latest scam

24 March 2009

With all due respect…

— group @ 11:33 AM

There was a great comedy piece a few years back (whose origin escapes us) that gave examples of how the English would use their language when speaking to a non-native speaker to imply the precise opposite of what was actually being understood. This allowed the English to feel superior without actually damaging international relations. One example was the phrase "with all due respect" which is generally understood to imply that the speaker has a great deal of respect for their counterpart, while the speaker is actually implying that they have no respect in the slightest for their interlocutor. The respect due being precisely zero.

This thought occurred to us when a few of us opened our email this week to see a draft ad being sent around by the Cato Institute (i.e. Pat Michaels) looking for signatories prior to being published in "major US newspapers" sometime soon:

There are a number of amusing details here. While we are curious about the credentials of "Dr. N. Here", we certainly understand why they are looking for a little more variety on the list. More surprising (and somewhat ironically) the mailing list for signature requests includes a number of scientists who don't agree with these sentiments at all. It's as if Michaels and Cato actually believe that these various lists of "dissenting" scientists are accurate reflections of support for their agenda. They appear to be have been conned by their own disinformation.

As an exercise for our readers, perhaps people would like to speculate on who is going to end up on the published list? (If indeed it gets published). Ginger Spice would be likely on past form, but they might improve the screening this time around…

But most amusing are the footnotes that they use to bolster their case. There are four: the brand new Swanson and Tsonis (GRL, 2009), Brohan et al (JGR, 2006) (which is there to provide a link to the HadCRU temperature data), Pielke et al (BAMS, 2005), and the oft-derided Douglass et al (IJoC, 2008).

Of these papers, not one has the evidence to support the statements attributed to them in the main text. To wit:

Surface temperature changes over the past century have been episodic and modest and there has been no net global warming for over a decade now.1,2

Well, the first part of the statement is exactly what you expect with a modest long-term trend in the presence of internal variability and is not controversial in the least. The "global warming stopped" meme is particularly lame since it relies on both a feigned ignorance of the statistics of short periods and being careful about which data set you use. It also requires cherry-picking the start year, had the period been "exactly a decade" or 12 years then all the trends are positive.

The use of the recent Swanson and Tsonis paper is simply opportunism. Those authors specifically state that their results are not in any way contradictory with the idea of a long term global warming trend. Instead they are attempting to characterise the internal variability that everyone knows exists.

After controlling for population growth and property values, there has been no increase in damages from severe weather-related events.3

This references a short comment in BAMS that didn't present any original research. The latest figures show that weather-related damages have increased markedly, though whether there is a climate change component is hard to tease out given the large increases in vulnerable infrastructure and relatively poor data. The actual statement that a clear global warming-related trend in damages hasn't been clearly demonstrated doesn't imply that you can state definitively that there is no effect. There might be one (or not), but formal attribution is hard. However, whatever the attribution ends up being, pointing out that there are other problems in the world doesn't imply that anthropogenic climate change is not worth worrying about. One might as well state that since knee injuries on ski-slopes have increased over time one shouldn't support flu shots.

The computer models forecasting rapid temperature change abjectly fail to explain recent climate behavior.4

'Abjectly'? Very strange choice of word…. and an even stranger choice of reference. This is of course the same Douglass et al paper that used completely incoherent statistics and deliberately failed to note the structural uncertainty in the observations. Unsurprisingly, Michaels does not reference the rather comprehensive demolition of the Douglass methodology published by Santer et al (2008) (and on which one of us was a co-author). More fundamentally however, the current temperatures are still within the spread of the models even if you cherry pick your start date. No-one expects the real world (a single realization) to follow the mean forced trend at all times. How is that a failure, abject or otherwise?

More interestingly is what is not cited. President Obama's statement "The science is beyond dispute and the facts are clear", can't possibly refer to every issue in science or every potential fact. Instead he is likely referring to the basic and pretty much uncontested facts that i) CO2 and other greenhouse gases have increased due to human activity. CO2 emissions in particular continue to increase at a rapid rate; ii) the effect of these gases is to warm the climate and it is very likely that most of the warming over the last 50 years was in fact driven by these increases; and iii) the sensitivity of the climate is very likely large enough that serious consequences can be expected if carbon emissions continue on this path. We would be astonished if Michaels disputed this since he is on record as agreeing that the IPCC climate sensitivity range is likely to be correct and has never questioned the human contribution to CO2 and other GHG increases. He and his colleagues have even done analyses that show that after correcting for ENSO effects, there is no sign of a slowdown in global warming at all.

Instead this is a classic red-herring: Ignore the facts you don't dispute, pick some others that are ambiguous and imply that, because they are subject to some debate, we therefore know nothing. Michaels (and Cato) presumably thinks this kind of nonsense is politically useful and he may be correct. But should he claim it is scientifically defensible, we would have to answer:

"With all due respect, Dr. Michaels, that is not true."

Link to RealClimate blog: http://www.realclimate.org/index.php/archives/2009/03/with-all-due-respect/

R. F. Anderson et al., Science, Vol. 323, No. 5920: Wind-driven upwelling in the Southern Ocean and the deglacial rise in atmospheric CO2

Science (13 March 2009), Vol. 323, No. 5920, pp. 1443-1448; DOI: 10.1126/science.1167441


Research Articles

Wind-driven upwelling in the Southern Ocean and the deglacial rise in atmospheric CO2

R. F. Anderson,1,2* S. Ali,1,2 L. I. Bradtmiller,1,2{dagger} S. H. H. Nielsen,3 M. Q. Fleisher,1 B. E. Anderson,1 and L. H. Burckle1

Abstract

Wind-driven upwelling in the ocean around Antarctica helps regulate the exchange of carbon dioxide (CO2) between the deep sea and the atmosphere, as well as the supply of dissolved silicon to the euphotic zone of the Southern Ocean. Diatom productivity south of the Antarctic Polar Front and the subsequent burial of biogenic opal in underlying sediments are limited by this silicon supply. We show that opal burial rates, and thus upwelling, were enhanced during the termination of the last ice age in each sector of the Southern Ocean. In the record with the greatest temporal resolution, we find evidence for two intervals of enhanced upwelling concurrent with the two intervals of rising atmospheric CO2 during deglaciation. These results directly link increased ventilation of deep water to the deglacial rise in atmospheric CO2.

1 Lamont-Doherty Earth Observatory of Columbia University, Post Office Box 1000, Palisades, NY 10964, USA.
2 Department of Earth and Environmental Sciences, Columbia University, New York, NY 10027, USA.
3 Antarctic Marine Geological Research Facility, Florida State University, Tallahassee, FL 32306, USA.

{dagger} Present address: Department of Marine Chemistry and Geochemistry, Woods Hole Oceanographic Institution, Woods Hole, MA 02543, USA.

*Correspondence. e-mail: boba@ldeo.columbia.edu

Read the Full Text


Link to this abstract: http://www.sciencemag.org/cgi/content/abstract/323/5920/1443

Robert Anderson et al., Science, Wind shifts may stir CO2 from Antarctic depths

Wind shifts may stir CO2 from Antarctic depths

environmentalresearchweb.org, March 20, 2009

Releases may have speeded end of last ice age, and could act again.

Natural releases of carbon dioxide from the Southern Ocean due to shifting wind patterns could have amplified global warming at the end of the last ice age – and could be repeated as manmade warming proceeds, a new paper in the journal Science suggests.

Many scientists think that the end of the last ice age was triggered by a change in Earth's orbit that caused the northern part of the planet to warm. This partial climate shift was accompanied by rising levels of the greenhouse gas CO2, ice core records show, which could have intensified the warming around the globe. A team of scientists at Columbia University's Lamont-Doherty Earth Observatory now offers one explanation for the mysterious rise in CO2: the orbital shift triggered a southward displacement in westerly winds, which caused heavy mixing in the Southern Ocean around Antarctica, pumping dissolved carbon dioxide from the water into the air.

"The faster the ocean turns over, the more deep water rises to the surface to release CO2," said lead author Robert Anderson, a geochemist at Lamont-Doherty. "It's this rate of overturning that regulates CO2 in the atmosphere." In the last 40 years, the winds have shifted south much as they did 17,000 years ago, said Anderson. If they end up venting more CO2 into the air, manmade warming underway now could be intensified.

Scientists have been studying the oceans for more than 25 years to understand their influence on CO2 levels and the glacial cycles that have periodically heated and chilled the planet for more than 600,000 years. Ice cores show that the ends of other ice ages also were marked by rises in CO2.

Two years ago, J.R. Toggweiler, a scientist at the National Oceanic and Atmospheric Administration (NOAA), proposed that westerly winds in the Southern Ocean around Antarctica may have undergone a major shift at the end of the last ice age. This shift would have raised more CO2-rich deep water to the surface, and thus amplified warming already taking place due to the earth's new orbital position. Anderson and his colleagues are the first to test that theory by studying sediments from the bottom of the Southern Ocean to measure the rate of overturning.

The scientists say that changes in the westerlies may have been triggered by two competing events in the northern hemisphere about 17,000 years ago. The Earth's orbit shifted, causing more sunlight to fall in the north, partially melting the ice sheets that then covered parts of the United States, Canada and Europe. Paradoxically, the melting may also have spurred sea-ice formation in the North Atlantic Ocean, creating a cooling effect there. Both events would have caused the westerly winds to shift south, toward the Southern Ocean. The winds simultaneously warmed Antarctica and stirred the waters around it. The resulting upwelling of CO2 would have caused the entire globe to heat.

Anderson and his colleagues measured the rate of upwelling by analysing sediment cores from the Southern Ocean. When deep water is vented, it brings not only CO2 to the surface but nutrients. Phytoplankton consume the extra nutrients and multiply.

In the cores, Anderson and his colleagues say spikes in plankton growth between roughly 17,000 years ago and 10,000 years ago indicate added upwelling. By comparing those spikes with ice core records, the scientists realized the added upwelling coincided with hotter temperatures in Antarctica as well as rising CO2 levels.

In the same issue of Science, Toggweiler writes a column commenting on the work. "Now I think this really starts to lock up how the CO2 changed globally," he said in an interview. "Here's a mechanism that can explain the warming of Antarctica and the rise in CO2. It's being forced by the north, via this change in the winds."

At least one model supports the evidence. Richard Matear, a researcher at Australia's Commonwealth Scientific and Industrial Research Organisation, describes a scenario in which winds shift south and produce an increase in CO2 venting in the Southern Ocean. Plants, which incorporate CO2 during photosynthesis, are unable to absorb all the added nutrients, causing atmospheric CO2 to rise.

Some other climate models disagree. In those used by the Intergovernmental Panel on Climate Change, the westerly winds do not simply shift north-south. "It's more complicated than this," said Axel Timmermann, a climate modeler at the University of Hawaii. Even if the winds did shift south, Timmermann argues, upwelling in the Southern Ocean would not have raised CO2 levels in the air. Instead, he says, the intensification of the westerlies would have increased upwelling and plant growth in the Southeastern Pacific, and this would have absorbed enough atmospheric CO2 to compensate for the added upwelling in the Southern Ocean.

"Differences among model results illustrate a critical need for further research," said Anderson. These, include "measurements that document the ongoing physical and biogeochemical changes in the Southern Ocean, and improvements in the models used to simulate these processes and project their impact on atmospheric CO2 levels over the next century."

Anderson says that if his theory is correct, the impact of upwelling "will be dwarfed by the accelerating rate at which humans are burning fossil fuels." But, he said, "It could well be large enough to offset some of the mitigation strategies that are being proposed to counteract rising CO2, so it should not be neglected."

In addition to Anderson, the paper was coauthored by Simon Nielsen of Florida State University, and five Lamont-Doherty researchers: Shahla Ali, Louisa Bradtmiller, Martin Fleisher, Brenton Anderson and Lloyd Burckle. The study was funded by NOAA, the National Science Foundation, Norwegian Research Council and Norwegian Polar Institute.

Source: columbia

Link to article: http://environmentalresearchweb.org/cws/article/yournews/38319

Ron Kirk asked to explain Obama’s position on U.S. climate tariffs

Kirk asked to explain Obama’s position on U.S. climate tariffs
by Tina Seeley, Bloomberg, March 26, 2009

Republican lawmakers asked U.S. Trade Representative Ron Kirk to explain the Obama administration’s position on imposing tariffs on imports from countries that aren’t limiting greenhouse gas emissions.

Representative Joe Barton of Texas, the senior Republican on the House Energy and Commerce Committee, and three other Republicans questioned the policy in a letter to Kirk today that was posted on the committee Web site.

The lawmakers said their concerns stem from statements Energy Secretary Steven Chu made at a March 17 hearing, during which he said tariffs could be considered as a way to handle an competitive “disadvantage” for U.S. companies competing with businesses in nations that don’t try to limit carbon emissions.

“To our knowledge, Secretary Chu’s comments represented the first public statement by an Obama administration official that the United States is contemplating duties or tariffs on imported goods manufactured in countries that do not participate in emissions reduction schemes,” the lawmakers wrote.

President Barack Obama, in an effort to fight global warming, has set a goal of cutting carbon-dioxide emissions 80 percent by 2050 from 1990 levels. Former President George W. Bush cited the lack of participation by nations including China and India as part of his rationale for not supporting the Kyoto Protocol, an international treaty limiting emissions.

Link to article: http://www.bloomberg.com/apps/news?pid=20601130&sid=aHe3Qq7ckwkA

J. A. Lowe et al., Environ. Res. Lett., Vol. 4, How difficult is it to recover from dangerous levels of global warming?

Environmental Research Letters, 4 (2009) 014012 (9 pp.); doi: 10.1088/1748-9326/4/1/014012

How difficult is it to recover from dangerous levels of global warming?


J A Lowe1, C Huntingford2, S C B Raper3, C D Jones4, S K Liddicoat4 and L K Gohar1
1 Met Office Hadley Centre (Reading Unit), Department of Meteorology, University of Reading, Reading RG6 6BB, UK
2 Centre for Ecology and Hydrology, Wallingford OX10 8BB, UK
3 Centre for Air Transport and the Environment, Manchester Metropolitan University, Manchester M1 5GD, UK
4 Met Office Hadley Centre, FitzRoy Road, Exeter EX1 3PB, UK

Abstract

Climate models provide compelling evidence that if greenhouse gas emissions continue at present rates, then key global temperature thresholds (such as the European Union limit of two degrees of warming since pre-industrial times) are very likely to be crossed in the next few decades. However, there is relatively little attention paid to whether, should a dangerous temperature level be exceeded, it is feasible for the global temperature to then return to safer levels in a usefully short time. We focus on the timescales needed to reduce atmospheric greenhouse gases and associated temperatures back below potentially dangerous thresholds, using a state-of-the-art general circulation model. This analysis is extended with a simple climate model to provide uncertainty bounds. We find that even for very large reductions in emissions, temperature reduction is likely to occur at a low rate. Policy-makers need to consider such very long recovery timescales implicit in the Earth system when formulating future emission pathways that have the potential to 'overshoot' particular atmospheric concentrations of greenhouse gases and, more importantly, related temperature levels that might be considered dangerous.

For more information on this article, see environmentalresearchweb.org

(Received 9 February 2009, accepted for publication 25 February 2009, published 11 March 2009.)

Link to this abstract: http://www.iop.org/EJ/abstract/1748-9326/4/1/014012/


Jason Lowe, Met Office Hadley Centre: Even for very large reductions in CO2 emissions, temperature reduction is likely to occur at a low rate

Lowering temperatures could be a slow process

Liz Kalaugher, environmentalresearchweb, March 24, 2009

The European Union has set a target level of 2 °C to prevent "dangerous" climate change. But if greenhouse gas emissions continue at their current rates it's likely that such thresholds will be crossed, says a UK team. With that in mind, the researchers assessed how fast the system may be able to return to safer temperatures once emissions have been cut; the news is not good.

"We find that even for very large reductions in emissions, temperature reduction is likely to occur at a low rate," write the scientists from the UK Met Office, Centre for Ecology and Hydrology, and Manchester Metropolitan University in Environmental Research Letters.

The researchers used a state-of-the-art general circulation model to study the timescale needed for temperatures to return below the threshold. Then they used a simple climate model to provide uncertainty bounds for their calculations.

"We used the most complex type of model to look at temperature overshoot in aggressive mitigation scenarios because previously this had only been done using simpler types of model," Jason Lowe of the Met Office Hadley Centre told environmentalresearchweb. "However, once we proved the method, we also needed to use a simpler model ourselves to look at uncertainty. IPCC AR4 spent a lot of time looking at uncertainty in projections for scenarios of increasing temperature so it was natural that we extended our work to include uncertainty estimates of recovery time after the peak."

Lowe says the team's main result is its estimate of how uncertainty in key climate parameters, such as climate sensitivity, affects the recovery from peak temperature back below various threshold levels. Another key achievement is the use of a complex climate model to confirm a result previously seen in models of intermediate complexity – that recovery from peak temperatures may take long periods of time.

"The paper is policy-relevant because it shows that rather than just considering the probability of meeting or exceeding given temperature targets (like the EU 2 °C target), we should also take account of the length of time spent over the target if it is exceeded," said Lowe. "In other words, policy makers and scientists need to consider the resilience of systems and human systems – people – to temporarily experiencing high temperatures."

Now the researchers plan to look at how the temperature overshoot scenarios they considered affect key physical climate thresholds. They say they are already making progress on the impacts on tropical forests and the Greenland ice sheet.

Liz Kalaugher is editor of environmentalresearchweb

Link to article: http://environmentalresearchweb.org/cws/article/futures/38360

NASA's Earth Observatory: Sunspots at Solar Maximum and Minimum (another Maunder Minimum unlikely)

Sunspots at Solar Maximum and Minimum

NASA's Earth Observatory, March 20, 2009
Sunspots
Sunspots at Solar Maximum and Minimum
acquired July 19, 2000 - March 18, 2009
Ultraviolet
Sunspots at Solar Maximum and Minimum
acquired July 19, 2000 - March 18, 2009
download large image (457 KB, GIF) acquired July 19, 2000
download large image (602 KB, GIF) acquired March 18, 2009
download large image (810 KB, JPEG) acquired July 19, 2000
download large image (658 KB, JPEG) acquired March 18, 2009

Our Sun is always too bright to view with the naked eye, but it is far from unchanging. It experiences cycles of magnetic activity. Areas of strong activity manifest as visible spots—sunspots—on the Sun’s surface. The year 2008, however, earned the designation as the Sun’s “blankest year” of the space age. Our Sun experienced fewer spots in 2008 than it had since the 1957 launch of Sputnik. As of March 2009, the Sun was continuing its quiet pattern.

These images from the Solar and Heliospheric Observatory (SOHO) spacecraft compare sunspots on the Sun’s surface (top row) and ultraviolet light radiating from the solar atmosphere (bottom row) at the last solar maximum (2000, left column) and at the current solar minimum (2009, right column.) The sunspot images were captured by the Michelson Doppler Imager (MDI) using filtered visible light. On March 18, 2009, the face of the Sun was spotless.

The other set of images, acquired by the Extreme Ultraviolet Imaging Telescope (EIT), shows ultraviolet light radiating from the layer of the atmosphere just above the Sun’s surface. This part of the solar atmosphere is about 60,000 Kelvin—a thousand times hotter than the surface of the Sun itself. On July 19, 2000, the solar atmosphere was pulsating with activity: in addition to several extremely bright (hot) spots around the mid-latitudes, there were also numerous prominences around the edge of the disk. On March 18, 2009, however, our star was relatively subdued.

The long stretch of minimal solar activity in 2008 and early 2009 prompted some questions about whether the Sun’s quiescence was beginning to rival that of the Maunder Minimum in the late seventeenth and early eighteenth centuries. Of the 2008 minimum, solar physicist David Hathaway of the NASA Marshall Space Flight Center says, “It’s definitely been an exceptional minimum, but only compared to the past 50 years.” Citing human observations of the Sun extending back four centuries, he continues, “If we go back 100 years, we see that the 1913 minimum was at least as long and as deep as this one.” So although the minimal activity of the Sun in 2008-2009 is exceptional for the “modern” era, it does not yet rival the lowest levels of solar activity that have ever been observed.

Centuries of observations have shown that the number of sunspots waxes and wanes over a roughly 11-year period. Sunspots exhibit other predictable behavior. If you map the location of the spots on the Sun’s surface over the course of a solar cycle, the pattern they make is shaped like a butterfly. The reason for the butterfly pattern is that the first sunspots of each new solar cycle occur mostly at the Sun’s mid-latitudes, but as the solar cycle progresses, the area of maximum sunspot production shifts toward the (solar) equator. Since regular sunspot observations began, astronomers have documented 24 cycles of sunspot activity. The images acquired in July 2000 showed the Sun near the peak of Solar Cycle 23. That cycle waned in late 2007, and Solar Cycle 24 began in early 2008, but showed minimal activity through early 2009.

The small changes in solar irradiance that occur during the solar cycle exert a small influence on Earth’s climate, with periods of intense magnetic activity (the solar maximum) producing slightly higher temperatures, and solar minimum periods such as that seen in 2008 and early 2009 likely to have the opposite effect. Periods of intense magnetic activity on the Sun can spawn severe space weather that damages infrastructure in our high-tech society.

Roughly a million miles away from our planet, the SOHO spacecraft sits between Earth and the Sun, giving us an unobstructed view of the nearest star. Besides the vernal equinox, March 20 marks annual Sun-Earth day, on which NASA celebrates daytime astronomy.

Link to article: http://earthobservatory.nasa.gov/IOTD/view.php?id=37575

Michael Brooks: Space storm alert -- 90 seconds from catastrophe (Carrington event, coronal mass ejection of plasma from the sun, space weather)

by Michael Brooks, New Scientist, March 25, 2009

IT IS midnight on 22 September 2012 and the skies above Manhattan are filled with a flickering curtain of colourful light. Few New Yorkers have seen the aurora this far south but their fascination is short-lived. Within a few seconds, electric bulbs dim and flicker, then become unusually bright for a fleeting moment. Then all the lights in the state go out. Within 90 seconds, the entire eastern half of the US is without power.

A year later and millions of Americans are dead and the nation's infrastructure lies in tatters. The World Bank declares America a developing nation. Europe, Scandinavia, China and Japan are also struggling to recover from the same fateful event -- a violent storm, 150 million kilometres away on the surface of the sun.

It sounds ridiculous. Surely the sun couldn't create so profound a disaster on Earth. Yet an extraordinary report funded by NASA and issued by the US National Academy of Sciences (NAS) in January this year claims it could do just that.

Over the last few decades, western civilisations have busily sown the seeds of their own destruction. Our modern way of life, with its reliance on technology, has unwittingly exposed us to an extraordinary danger: plasma balls spewed from the surface of the sun could wipe out our power grids, with catastrophic consequences.

The projections of just how catastrophic make chilling reading. "We're moving closer and closer to the edge of a possible disaster," says Daniel Baker, a space weather expert based at the University of Colorado in Boulder, and chair of the NAS committee responsible for the report.

It is hard to conceive of the sun wiping out a large amount of our hard-earned progress. Nevertheless, it is possible. The surface of the sun is a roiling mass of plasma -- charged high-energy particles -- some of which escape the surface and travel through space as the solar wind. From time to time, that wind carries a billion-tonne glob of plasma, a fireball known as a coronal mass ejection (see "When hell comes to Earth"). If one should hit the Earth's magnetic shield, the result could be truly devastating.

The incursion of the plasma into our atmosphere causes rapid changes in the configuration of Earth's magnetic field which, in turn, induce currents in the long wires of the power grids. The grids were not built to handle this sort of direct current electricity. The greatest danger is at the step-up and step-down transformers used to convert power from its transport voltage to domestically useful voltage. The increased DC current creates strong magnetic fields that saturate a transformer's magnetic core. The result is runaway current in the transformer's copper wiring, which rapidly heats up and melts. This is exactly what happened in the Canadian province of Quebec in March 1989, and six million people spent 9 hours without electricity. But things could get much, much worse than that.

Worse than Katrina

The most serious space weather event in history happened in 1859. It is known as the Carrington event, after the British amateur astronomer Richard Carrington, who was the first to note its cause: "two patches of intensely bright and white light" emanating from a large group of sunspots. The Carrington event comprised eight days of severe space weather.

There were eyewitness accounts of stunning auroras, even at equatorial latitudes. The world's telegraph networks experienced severe disruptions, and Victorian magnetometers were driven off the scale.

Though a solar outburst could conceivably be more powerful, "we haven't found an example of anything worse than a Carrington event," says James Green, head of NASA's planetary division and an expert on the events of 1859. "From a scientific perspective, that would be the one that we'd want to survive." However, the prognosis from the NAS analysis is that, thanks to our technological prowess, many of us may not.

There are two problems to face. The first is the modern electricity grid, which is designed to operate at ever higher voltages over ever larger areas. Though this provides a more efficient way to run the electricity networks, minimising power losses and wastage through overproduction, it has made them much more vulnerable to space weather. The high-power grids act as particularly efficient antennas, channelling enormous direct currents into the power transformers.

The second problem is the grid's interdependence with the systems that support our lives: water and sewage treatment, supermarket delivery infrastructures, power station controls, financial markets and many others all rely on electricity. Put the two together, and it is clear that a repeat of the Carrington event could produce a catastrophe the likes of which the world has never seen. "It's just the opposite of how we usually think of natural disasters," says John Kappenman, a power industry analyst with the Metatech Corporation of Goleta, California, and an advisor to the NAS committee that produced the report. "Usually the less developed regions of the world are most vulnerable, not the highly sophisticated technological regions."

According to the NAS report, a severe space weather event in the US could induce ground currents that would knock out 300 key transformers within about 90 seconds, cutting off the power for more than 130 million people (see map). From that moment, the clock is ticking for America.

First to go -- immediately for some people -- is drinkable water. Anyone living in a high-rise apartment, where water has to be pumped to reach them, would be cut off straight away. For the rest, drinking water will still come through the taps for maybe half a day. With no electricity to pump water from reservoirs, there is no more after that.

There is simply no electrically powered transport: no trains, underground or overground. Our just-in-time culture for delivery networks may represent the pinnacle of efficiency, but it means that supermarket shelves would empty very quickly -- delivery trucks could only keep running until their tanks ran out of fuel, and there is no electricity to pump any more from the underground tanks at filling stations.

Back-up generators would run at pivotal sites -- but only until their fuel ran out. For hospitals, that would mean about 72 hours of running a bare-bones, essential care only, service. After that, no more modern healthcare.

72 hours of healthcare remaining

The truly shocking finding is that this whole situation would not improve for months, maybe years: melted transformer hubs cannot be repaired, only replaced. "From the surveys I've done, you might have a few spare transformers around, but installing a new one takes a well-trained crew a week or more," says Kappenman. "A major electrical utility might have one suitably trained crew, maybe two."

Within a month, then, the handful of spare transformers would be used up. The rest will have to be built to order, something that can take up to 12 months.

Even when some systems are capable of receiving power again, there is no guarantee there will be any to deliver. Almost all natural gas and fuel pipelines require electricity to operate. Coal-fired power stations usually keep reserves to last 30 days, but with no transport systems running to bring more fuel, there will be no electricity in the second month.

30 days of coal left

Nuclear power stations wouldn't fare much better. They are programmed to shut down in the event of serious grid problems and are not allowed to restart until the power grid is up and running.

With no power for heating, cooling or refrigeration systems, people could begin to die within days. There is immediate danger for those who rely on medication. Lose power to New Jersey, for instance, and you have lost a major centre of production of pharmaceuticals for the entire US. Perishable medications such as insulin will soon be in short supply. "In the US alone there are a million people with diabetes," Kappenman says. "Shut down production, distribution and storage and you put all those lives at risk in very short order."

Help is not coming any time soon, either. If it is dark from the eastern seaboard to Chicago, some affected areas are hundreds, maybe thousands of miles away from anyone who might help. And those willing to help are likely to be ill-equipped to deal with the sheer scale of the disaster. "If a Carrington event happened now, it would be like a hurricane Katrina, but 10 times worse," says Paul Kintner, a plasma physicist at Cornell University in Ithaca, New York.

In reality, it would be much worse than that. Hurricane Katrina's societal and economic impact has been measured at $81 billion to $125 billion. According to the NAS report, the impact of what it terms a "severe geomagnetic storm scenario" could be as high as $2 trillion. And that's just the first year after the storm. The NAS puts the recovery time at four to 10 years. It is questionable whether the US would ever bounce back.

4-10 years to recover

"I don't think the NAS report is scaremongering," says Mike Hapgood, who chairs the European Space Agency's space weather team. Green agrees. "Scientists are conservative by nature and this group is really thoughtful," he says. "This is a fair and balanced report."

Such nightmare scenarios are not restricted to North America. High latitude nations such as Sweden and Norway have been aware for a while that, while regular views of the aurora are pretty, they are also reminders of an ever-present threat to their electricity grids. However, the trend towards installing extremely high voltage grids means that lower latitude countries are also at risk. For example, China is on the way to implementing a 1000-kilovolt electrical grid, twice the voltage of the US grid. This would be a superb conduit for space weather-induced disaster because the grid's efficiency to act as an antenna rises as the voltage between the grid and the ground increases. "China is going to discover at some point that they have a problem," Kappenman says.

Neither is Europe sufficiently prepared. Responsibility for dealing with space weather issues is "very fragmented" in Europe, says Hapgood.

Europe's electricity grids, on the other hand, are highly interconnected and extremely vulnerable to cascading failures. In 2006, the routine switch-off of a small part of Germany's grid -- to let a ship pass safely under high-voltage cables -- caused a cascade power failure across western Europe. In France alone, five million people were left without electricity for two hours. "These systems are so complicated we don't fully understand the effects of twiddling at one place," Hapgood says. "Most of the time it's alright, but occasionally it will get you."

The good news is that, given enough warning, the utility companies can take precautions, such as adjusting voltages and loads, and restricting transfers of energy so that sudden spikes in current don't cause cascade failures. There is still more bad news, however. Our early warning system is becoming more unreliable by the day.

By far the most important indicator of incoming space weather is NASA's Advanced Composition Explorer (ACE). The probe, launched in 1997, has a solar orbit that keeps it directly between the sun and Earth. Its uninterrupted view of the sun means it gives us continuous reports on the direction and velocity of the solar wind and other streams of charged particles that flow past its sensors. ACE can provide between 15 and 45 minutes' warning of any incoming geomagnetic storms. The power companies need about 15 minutes to prepare their systems for a critical event, so that would seem passable.

15 minutes' warning

However, observations of the sun and magnetometer readings during the Carrington event shows that the coronal mass ejection was travelling so fast it took less than 15 minutes to get from where ACE is positioned to Earth. "It arrived faster than we can do anything," Hapgood says.

There is another problem. ACE is 11 years old, and operating well beyond its planned lifespan. The onboard detectors are not as sensitive as they used to be, and there is no telling when they will finally give up the ghost. Furthermore, its sensors become saturated in the event of a really powerful solar flare. "It was built to look at average conditions rather than extremes," Baker says.

He was part of a space weather commission that three years ago warned about the problems of relying on ACE. "It's been on my mind for a long time," he says. "To not have a spare, or a strategy to replace it if and when it should fail, is rather foolish."

There is no replacement for ACE due any time soon. Other solar observation satellites, such as the Solar and Heliospheric Observatory (SOHO) can provide some warning, but with less detailed information and -- crucially -- much later. "It's quite hard to assess what the impact of losing ACE will be," Hapgood says. "We will largely lose the early warning capability."

The world will, most probably, yawn at the prospect of a devastating solar storm until it happens. Kintner says his students show a "deep indifference" when he lectures on the impact of space weather. But if policy-makers show a similar indifference in the face of the latest NAS report, it could cost tens of millions of lives, Kappenman reckons. "It could conceivably be the worst natural disaster possible," he says.

The report outlines the worst case scenario for the US. The "perfect storm" is most likely on a spring or autumn night in a year of heightened solar activity -- something like 2012. Around the equinoxes, the orientation of the Earth's field to the sun makes us particularly vulnerable to a plasma strike.

What's more, at these times of year, electricity demand is relatively low because no one needs too much heating or air conditioning. With only a handful of the US grid's power stations running, the system relies on computer algorithms shunting large amounts of power around the grid and this leaves the network highly vulnerable to sudden spikes.

If ACE has failed by then, or a plasma ball flies at us too fast for any warning from ACE to reach us, the consequences could be staggering. "A really large storm could be a planetary disaster," Kappenman says.

So what should be done? No one knows yet -- the report is meant to spark that conversation. Baker is worried, though, that the odds are stacked against that conversation really getting started. As the NAS report notes, it is terribly difficult to inspire people to prepare for a potential crisis that has never happened before and may not happen for decades to come. "It takes a lot of effort to educate policy-makers, and that is especially true with these low-frequency events," he says.

We should learn the lessons of hurricane Katrina, though, and realise that "unlikely" doesn't mean "won't happen." Especially when the stakes are so high. The fact is, it could come in the next three or four years -- and with devastating effects. "The Carrington event happened during a mediocre, ho-hum solar cycle," Kintner says. "It came out of nowhere, so we just don't know when something like that is going to happen again."

Link to article: http://www.newscientist.com/article/mg20127001.300-space-storm-alert-90-seconds-from-catastrophe.html?full=true