Showing posts with label Antarctic Circumpolar Current. Show all posts

"Warming of global abyssal and deep Southern Ocean waters between the 1990s and 2000s: Contributions to global heat and sea level rise budgets by Sarah G. Purkey &

Journal of Climate,


Warming of global abyssal and deep Southern Ocean waters between the 1990s and 2000s: Contributions to global heat and sea level rise budgets

Sarah G. Purkey¹,² and Gregory C. Johnson²,¹,*


¹School of Oceanography, University of Washington, Seattle, WA 98195, U.S.A.
²NOAA/Pacific Marine Environmental Laboratory, Seattle, WA 98115, U.S.A.


Abstract


We quantify abyssal global and deep Southern Ocean temperature trends between 
the 1990s and 2000s to assess the role of recent warming of these regions in global heat 
and sea level budgets. We compute warming rates with uncertainties along 28 full-depth, 
high-quality, hydrographic sections that have been occupied two or more times between 
1980 and 2010. We divide the global ocean into 32 basins defined by the topography and 
climatological ocean bottom temperatures and estimate temperature trends in the 24 
sampled basins. The three southernmost basins show a strong statistically significant 
abyssal warming trend, with that warming signal weakening to the north in the central 
Pacific, western Atlantic, and eastern Indian Oceans. Eastern Atlantic and western Indian 
Ocean basins show statistically insignificant abyssal cooling trends. Excepting the Arctic 
Ocean and Nordic seas, the rate of abyssal (below 4000 m) global ocean heat content 
change in the 1990s and 2000s is equivalent to a heat flux of 0.027 (±0.009) W m–2 
applied over the entire surface of the Earth. Deep (1000–4000 m) warming south of the 
Sub-Antarctic Front of the Antarctic Circumpolar Current adds 0.068 (±0.062) W m–2. 
The abyssal warming produces a 0.053 (±0.017) mm yr–1 increase in global average sea 
level and the deep warming south of the Sub-Antarctic Front adds another 0.093 (±0.081) 
mm yr–1. Thus warming in these regions, ventilated primarily by Antarctic Bottom 
Water, accounts for a statistically significant fraction of the present global energy and sea 
level budgets.


*Correspondence e-mail:  gregory.c.johnson@noaa.gov

Link to full paper (pdf file):  http://www.pmel.noaa.gov/people/gjohnson/Recent_AABW_Warming_v3.pdf

"Billions of blow dryers: Some missing heat returns to haunt us" by Doug Bostrom, Skeptical Science

Billions of blow dryers: Some missing heat returns to haunt us

"The heat will come back to haunt us sooner or later..." -- Kevin Trenberth, referring to our inability over the past 5 years to locate half a watt per square meter per year of energy accumulated on Earth as a result of anthropogenic warming of the planet, approximately half of the expected warming signal.
by Doug Bostrom, Skeptical Science, September 23, 2010
It's a sad fact that while Earth's oceans are expected to absorb the vast majority of anthropogenically induced imbalance of the global energy budget, our physical observations of the caloric state of the deep ocean are conspicuously sparse when compared to daily remote sensing revisitations enjoyed by research subjects amenable to orbital remote sensing platforms. In some ways our instrumentation of such far-flung places as Mars and Venus is better than what we deploy here on Earth in the abyssal depths. While we have solid theoretical grounding for predicting storage of excess heat in the ocean, without the means to directly measure and accurately quantify this effect we're left missing not only heat but also a useful means of testing and validating predictions of climate sensitivity to forcing.  
As our technical capacities have risen to the challenge of dealing with an environment arguably more hostile to instrumentation than near-Earth orbital space, oceanographers at last are enjoying some of the same physical and scientific advantages as those long enjoyed by scientists working with space-based remote sensing platforms. The semi-autonomous Argo array represents a huge leap forward in our understanding of the characteristics of the upper ocean. With respect to anthropogenic climate change, of late we've been treated to increasingly dense and accurate measurements of upper ocean heat content, greatly refining our ability gather this important data.
Unfortunately the present Argo implementation is depth-limited, and we thus still have no automated systems in place for data retrieval from the slightly over one half of the ocean inaccessible to robotic probes. For this majority of ocean volume we still must rely on hardy investigators "going down to the sea in ships, that do business in great waters." We landlubbers wondering about "missing heat" and suspecting it may be found in the ocean can only be patient as we wait for salt-crusted mariner scientists to return to shore and write up their results.
The main reason for lamentation of  "Trenberth's Travesty" is the declining upward pace over the past 5 years of the portion of ocean heat content (OHC) we're readily able to measure. We know that sea level rise (SLR) is principally caused by both thermal expansion of the oceans and water mass contributed by continued melting of terrestrial ice. Terrestrial ice alone cannot account for the continuing sea level rise we see in the face of the slackened pace of upper ocean warming.  Juxtaposing continuing sea level rise against OHC we don't observe, we're left with a substantial technical mystery, an inability to "close the budget" of SLR as well as an inability to specifically account for the final destination of heat we know is accumulating on the planet (Willis 2008). Failing the unlikely emergence of some new mechanism able to cause SLR, we may say with reasonable confidence that continued SLR can at least partially be attributed to accumulating OHC we can't directly "see," but merely saying so is no substitute for direct measurements.
Now we may say some significant progress has been made in tracking down "missing heat." In the Journal of Climate, Sarah Purkey of the University of Washington and NOAA's Gregory Johnson report on an ambitious project to quantify heat being stored in the abyssal ocean ("Warming of Global Abyssal and Deep Southern Ocean Waters Between the 1990s and 2000s: Contributions to Global Heat and Sea Level Rise Budgets"). By revisiting abyssal stations included in the World Ocean Circulation Experiment (WOCE) conducted in the 1990s, about 20% of Trenberth's famous "missing heat" appears to have been tracked down, found to be slowly traveling north from the Southern Ocean.
While integrating these new measurements into the global heat budget does not entirely close our observational gap, by producing their results Purkey and Johnson have crisply demonstrated how vast amounts of heat may have been left out of the budget for the simple reason of previously being invisible. Their work is also a compelling case for improving our capability to routinely measure with less extraordinary effort the majority of ocean volume we're presently forced to ignore when accounting for accumulation of heat. Finally, it seems reasonable to conclude that these measurements bolster our confidence in SLR as a proxy for increasing OHC. 
Purkey and Johnson's abstract: 
We quantify abyssal global and deep Southern Ocean temperature trends between the 1990s and 2000s to assess the role of recent warming of these regions in global heat and sea level budgets. We compute warming rates with uncertainties along 28 full-depth, high-quality, hydrographic sections that have been occupied two or more times between 1980 and 2010. We divide the global ocean into 32 basins defined by the topography and climatological ocean bottom temperatures and estimate temperature trends in the 24 sampled basins. The three southernmost basins show a strong statistically significant abyssal warming trend, with that warming signal weakening to the north in the central Pacific, western Atlantic, and eastern Indian Oceans. Eastern Atlantic and western Indian Ocean basins show statistically insignificant abyssal cooling trends. Excepting the Arctic Ocean and Nordic seas, the rate of abyssal (below 4000 m) global ocean heat content change in the 1990s and 2000s is equivalent to a heat flux of 0.027 (±0.009) W m–2 applied over the entire surface of the Earth. Deep (1000–4000 m) warming south of the Sub-Antarctic Front of the Antarctic Circumpolar Current adds 0.068 (±0.062) W m–2. The abyssal warming produces a 0.053 (±0.017) mm yr–1 increase in global average sea level and the deep warming south of the Sub-Antarctic Front adds another 0.093 (±0.081) mm yr–1. Thus warming in these regions, ventilated primarily by Antarctic Bottom Water, accounts for a statistically significant fraction of the present global energy and sea level budgets. 
In an interview, coauthor Gregory Johnson expressed the amount of heat identified in this study in amusingly prosaic terms: the newly located reservoir of energy is akin to what would be liberated by loading every man, woman and child on Earth with five 1,400-watt hairdryers each and running those appliances continuously for the 20-year interval between measurements. 
Purkey and Johnson's results, mapped:
 

"Mean local heat fluxes through 4000 m implied by abyssal warming below 4000 m from the 1990s to the 2000s within each of the 24 sampled basins (black numbers and colorbar) with 95% confidence intervals and the local contribution to the heat flux through 1000 m south of the SAF (magenta line) implied by deep Southern Ocean warming from 1000–4000 m is also given (magenta number) with its 95% confidence interval." (Purkey & Johnson 2010)
How can Antarctic Bottom Water (AABW) influence abyssal temperatures so far north of the Antarctic? To understand this, it's helpful to grasp the huge role in deep ocean circulation played by the Southern Ocean and the Antarctic. AABW is derived from enormous quantities of chilled, relatively saline and thus dense water sinking at the extreme south of the globe, in Antarctic waters. This mass of dense water is relatively free to travel north, first plunging off the Antarctic continental shelf and then hugging the bottom as it displaces warmer water. AABW is steered by bottom topography and Coriolis forces and only ceases moving and thus influencing abyssal temperatures when it has reached equilibrium density with surrounding water. Even after traveling some 60 degrees north of its source, density differences are still large enough to drive substantial amounts of AABW past the circulation barrier imposed by the equator, thus permitting diminished but still measurable circulation effects of AABW to be measured in the abyssal depths of the Northern Hemisphere. 
A pair of illustrations of Antarctic and Southern Ocean circulation may be helpful in understanding the process of AABW transport.  

"South (left) to north (right) section through the overturning circulation in the
Southern Ocean. South-flowing products of deep convection in the North Atlantic are converted into upper-layer mode and intermediate waters and deeper bottom waters and returned northward. Marked are the positions of the main fronts (PF,  Polar Front; SAF,  Sub-Antarctic Front; STF, Subtropical Front) and water masses (AABW, Antarctic Bottom Water; LCDW and UCDW, Lower and Upper Circumpolar Deep Waters; NADW, North Atlantic Deep Water; AAIW, Antarctic Intermediate Water; SAMW, Sub-Antarctic Mode Water)" (Figure 1.9, SCAR "Antarctic Climate Change and the Environment" )
Role of Southern Ocean in global circulation ( Lumpkin & Speer 2007 ) 
One might wonder, if AABW circulation is driven partly by the relative density of water chilled in the Antarctic, won't distribution of this water change as deep waters warm in response to heating by AABW circulation, thus robbing AABW of some of its physical transport impetus? This does seem to be the case; for instance, the interface between AABW and North Atlantic Deep Water (NADW) has deepened over the past few decades, and as well there are indications of diminished abyssal circulation in regions of the North Pacific influenced by AABW, as would be expected in a scenario where density gradients are diminishing (Johnson 2008Kouketsu 2008). Numerous other variations in circulation behaviors controlled by thermally induced density variances may be found in Purkey and Johnson. Taken together, these indicators are broadly consistent with changes in the thermal regime of the deep ocean connected with  AABW and its source. 
It's important to note that to a greater or lesser extent the Southern Annular Mode (SAM) plays some role in controlling changes observed in Purkey and Johnson, not to the exclusion of secular changes outside of the SAM but significant nonetheless. Complications abound in forming an exact assessment of the proportionality of natural versus forced variations; the SAM itself appears to be in a process of adjusting to two anthropogenic influences, ozone depletion and greenhouse gas proliferation. 
Beyond shedding enlightenment on a specific research topic, Purkey and Johnson's work suggests some improvements we could make in the level of urgency we attach to exploring our planet. NOAA is working on upgrading our ability to sample deep and abyssal ocean water via robotic instrumentation.  As is so often the case, the pace of instrumentation improvements is set in part by budgetary limitations involving amounts of money small in the grand scheme of things. Purkey and Johnson show beyond doubt how vital better observational ability is when it comes understanding our role in shaping the climate; we're effectively blind to enormous changes in the physics of our planet because we won't make paltry expenditures for better "optics," a lamentable and unnecessary condition.  Our instrumentational inability to closely track climate change is a general problem; it's truly odd that such a important research topic so crucial to public policy should find itself lacking the equipment to quantify changes nearly everybody agrees present us with multi-trillion dollar risk and decision choices and outcomes. 

Officially Off-topic: A Salute to Oceanographers

In terms of effective inaccessibility and remoteness, Earth's oceanic abyssal depths have aptly been compared unfavorably to extraterrestrial space.
For researchers investigating Earth's climate, orbital space is in some ways a far friendlier environment than the oceans. Instruments aboard satellites allow researchers to collect their data while lounging in shirtsleeve comfort, facing nothing more dangerous in the daily routine than slipping and falling while taking a morning shower.
Oceanographers often must wrest their primary information from the ocean, at personal risk, conducting their observations from the pitching, rolling decks of ships with course and speed set for instrument deployment as opposed to comfort and safety, directly exposed to the uncaring vagaries of fickle weather and heavy machinery. Errors in procedure, equipment or vessel failures or even inclement weather may exact the ultimate penalty on oceanographers seeing to the meticulous collection of data, career hazards not faced by many other scientists investigating climate-relate phenomena. 
Quite apart from the kinetic drama of working from small ships on the surface of such storied locales as the notoriously stormy Southern Ocean, the sea is also extraordinarily costly in terms of the personal investment of time required to wrest every few hundred kilobytes of data from the cold dark of the bottom. After dealing with a commute of thousands of miles to their laboratory enviroment, scientists are rewarded with brief spurts of information separated by long intervals of plodding, akin to "crossing the ocean at a jogging pace" as NOAA's Gregory Johnson expresses the matter. 
For all these reasons, it's worth pausing a moment in appreciation of the fanatical dedication and perseverance needed to collect data of the kind used to produce Purkey and Johnson's paper. The graphs and maps casually flung out in little essays such as the one above inadequately express countless thousands of cold and dripping hours spent in hostile conditions far from hearth and home. True enough it's an all-volunteer army, but recognition of this effort is still due.

Sea level rise: It's worse than we thought

Sea level rise: It's worse than we thought

by Anil Ananthaswamy, New Scientist, July 1, 2009

FOR a few minutes David Holland forgets about his work and screams like a kid on a roller coaster. The small helicopter he's riding in is slaloming between towering cliffs of ice -- the sheer sides of gigantic icebergs that had calved off Greenland's Jakobshavn glacier. "It was like in a James Bond movie," Holland says afterwards. "It's the most exciting thing I have ever done."

Jakobshavn has doubled its speed in the past 15 years, draining increasing amounts of ice from the Greenland ice sheet into the ocean, and Holland, an oceanographer at New York University, has been trying to find out why. Scientists like him are more than a little astonished at the rate at which our planet's frozen frontiers seem to be responding to global warming. The crucial question, though, is what will happen over the next few decades and centuries.

That's because the fate of the planet's ice, from relatively small ice caps in places like the Canadian Arctic, the Andes and the Himalayas, to the immense ice sheets of Greenland and Antarctica, will largely determine the speed and extent of sea level rise. At stake are the lives and livelihoods of hundreds of millions of people, not to mention millions of square kilometres of cities and coastal land, and trillions of dollars in economic terms.

In its 2007 report, the Intergovernmental Panel on Climate Change (IPCC) forecast a sea level rise of between 19 and 59 centimetres by 2100, but this excluded "future rapid dynamical changes in ice flow." Crudely speaking, these estimates assume ice sheets are a bit like vast ice cubes sitting on a flat surface, which will stay in place as they slowly melt. But what if some ice sheets are more like ice cubes sitting on an upside-down bowl, which could suddenly slide off into the sea as conditions get slippery? "Larger rises cannot be excluded but understanding of these effects is too limited to assess their likelihood," the IPCC report stated.

Even before it was released, the report was outdated. Researchers now know far more. And while we still don't understand the dynamics of ice sheets and glaciers well enough to make precise predictions, we are narrowing down the possibilities. The good news is that some of the scarier scenarios, such as a sudden collapse of the Greenland ice sheet, now appear less likely. The bad news is that there is a growing consensus that the IPCC estimates are wildly optimistic.

The oceans are already rising. Global average sea level rose about 17 cm in the 20th century, and the rate of rise is increasing. The biggest uncertainty for those trying to predict future changes is how humanity will behave. Will we start to curb our emissions of greenhouse gases sometime soon, or will we continue to pump ever more into the atmosphere?

Even if all emissions stopped today, sea level would continue to rise. "The current rate of rise would continue for centuries if temperatures are constant, and that would add about 30 cm per century to global sea level," says Stefan Rahmstorf of the Potsdam Institute for Climate Impact Research in Germany. "If we burn all fossil fuels, we are likely to end up with many metres of sea level rise in the long run, very likely more than 10 m in my view."

This might sound dramatic, but we know sea level has swung from 120 m lower than today during ice ages to more than 70 m higher during hot periods. There is no doubt at all that if the planet warms, the sea will rise. The key questions are, by how much and how soon?

To pin down the possibilities, researchers have to look at what will happen to all the different contributors to sea level under various emissions scenarios. The single biggest contributor to sea level rise over the past century has been the melting of glaciers and ice caps outside of Greenland and Antarctica, from Alaska to the Himalayas. According to one recent estimate, the continued loss of this ice will add another 10-20 cm to sea level by 2100. It cannot get much worse than this: even if all this ice melted, sea level would only rise by about 33 cm.

Expanding waters

The second biggest contributor has been thermal expansion of the oceans. Its future contribution is relatively simple to predict, as we know exactly how much water expands for a given increase in temperature. A study published earlier this year found that even if all emissions stopped once carbon dioxide levels hit 450 parts per million (ppm) -- an unrealistically optimistic scenario -- thermal expansion alone would cause sea level to rise by 20 cm by 2100, and by another 10 cm by 3000. At the other extreme, if emissions peak at 1200 ppm, thermal expansion alone would lead to a 0.5-m rise by 2100, and another 1.4 m by 3000 (see "How high, how soon?").

Then there are the great ice sheets of Greenland and Antarctica, which hold enough water to raise sea level by about 70 metres. Until recently, their contribution to sea level rise was negligible, and the IPCC predicted that Greenland would contribute 12 cm at most to sea level rise by 2100, while Antarctica would actually gain ice overall due to increased snowfall. "A lot of new results have been published since then to show that this very conservative conclusion does not hold," says Eric Rignot of the University of California, Irvine.

To study the ice sheets, Rignot and colleagues have combined satellite-based radar surveys, aircraft altimetry and gravity measurements using NASA's GRACE satellite. They found that ice loss is increasing fast. Greenland is now losing about 300 gigatonnes of ice per year, enough to raise sea level by 0.83 mm. Antarctica is losing about 200 gigatonnes per year, almost all of it from West Antarctica and the Antarctic Peninsula, raising levels by 0.55 mm. "The mass loss is increasing faster than in Greenland," Rignot says. "It'll overtake Greenland in years to come."

If this trend continues, Rignot thinks sea level rise will exceed 1 metre by 2100. So understanding why Greenland and Antarctica are already losing ice faster than predicted is crucial to improving our predictions.

The main reason for the increase is the speeding up of glaciers that drain the ice sheets into the sea. One cause is the knock-on effect of warmer air melting the surface of the ice: when the surface ice melts, the water pours down through crevasses and moulins to the base of glaciers, lubricating their descent into the sea. Fears about the impact of this phenomenon have receded somewhat, though: Antarctica is thought to be too cold for it to be a big factor, and even in Greenland it is only a summertime effect. "It's significant, but I don't think it's the primary mechanism that would be responsible for dramatic increases in sea level," says glaciologist Robert Bindschadler at the NASA Goddard Space Flight Center in Greenbelt, Maryland.

There is another way for surface melt to affect sea level, though. Meltwater fills any crevasses, widening and deepening the cracks until they reach all the way down to the base of the ice. This can have a dramatic effect on floating ice shelves. "Essentially, you are chopping up an ice shelf into a bunch of tall thin icebergs, like dominoes standing on their ends," says Bindschadler. "And they are not very stable standing that way." They fall over, and push their neighbours out to sea.

The most famous break-up in recent times -- that of the Larsen B ice shelf on the Antarctic Peninsula in 2002 -- likely happened this way. While the break-up of floating ice shelves does not raise sea level directly, the disintegration of Larsen B had consequences that models at the time failed to predict. With little to resist their advance, glaciers behind Larsen B immediately began to move up to eight times faster. Five smaller ice shelves in the rapidly warming Antarctic Peninsula have also broken up and many others are disintegrating.

What lies beneath

Surface melt poses little threat in West Antarctica, as it is so much colder. Here the danger comes from below. Take the ice shelf holding back the massive Pine Island glacier, which is thinning in a strange pattern. Radar scans have revealed giant "ripples" up to 100 m deep on its underside.

Bindschadler thinks that the currents created by winter winds raise relatively warm water from a few hundred metres down in the Amundsen Sea off West Antarctica. This melts the underside of the ice shelf and gets trapped in the space it carves out, thus continuing to melt the ice from below over a few seasons. As the ice shelf thins, the Pine Island glacier behind it is speeding up, from 3 km/year, three years ago, to over 4 km/year according to the latest unpublished measurements by Ian Joughin of the University of Washington in Seattle.

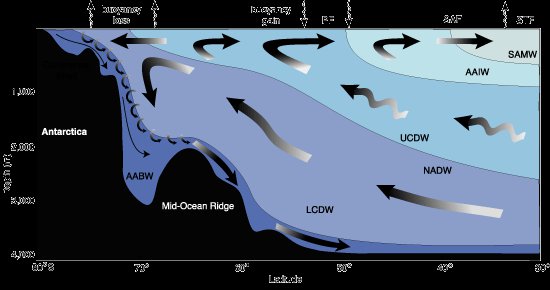
What does this have to do with global warming? Climate change, aided and abetted by the loss of ozone, has strengthened the winds that circle Antarctica. This is speeding up the Antarctic circumpolar current and pushing surface waters away from the coast, causing deeper, warmer water to well up.

Along with the Thwaites glacier and some smaller ones, Pine Island glacier drains a third of the West Antarctic ice sheet. This ice sheet is particularly vulnerable to ocean heat because much of it rests on the seabed, a kilometre or more below sea level. This submarine ice will not raise sea level if it melts, but if it goes a lot of higher-level ice will end up in the ocean. The vulnerable parts contain enough ice to raise sea level 3.3 m -- less than the 5 m that was once estimated but more than enough to have catastrophic effects.

Bindschadler has calculated that a change in ocean currents could potentially deliver up to 1019 joules of heat per year to the continental shelf off West Antarctica -- and only about 109 joules per year would be required to melt the ice shelves that hold back the Pine Island and Thwaites glaciers. "The ocean has an enormous amount of heat compared to the atmosphere," he says.

Even in Greenland, where the ice sheet rests on land above sea level, ocean heat still matters. When not dodging giant icebergs, Holland has been trying to find out why Greenland's Jakobshavn glacier started moving faster in 1997, speeding up from around 6 km/year to more than 9 km/year by 2000 and 13 km/year by 2003. The glacier continues to drain ice from the Greenland ice sheet at a higher rate than before.

The increase had been attributed to lubrication by meltwater, but Holland's team recently stumbled across data from local fishing boats, which deploy thermometers in bottom-trawling nets. One fact stood out: the temperature of the subsurface waters around West Greenland jumped in 1997, prior to the massive calving of Jakobshavn.

As the team reported last year, though, the real trigger lay in what happened in 1996. That year, the winds across the North Atlantic weakened, slowing down the warm Gulf Stream. The weakened current meandered aimlessly and hit west Greenland. "A modest change in wind gives you a big bang in terms of ice sheet dynamic response," says Holland.

Findings like these suggest that predicting sea level rise is even trickier than previously thought. If relatively small changes in winds and currents could have a big impact on ice sheets, we need extremely good models of regional climate as well as of ice sheets. At the moment we have neither -- and while regional climate models are improving, ice sheet models are still too crude to make accurate predictions.

"They are coarse models that don't include mechanisms that allow glaciers to speed up," says Rignot. "And what we are seeing today is that this is not only a big missing piece, this could be the dominant piece. We can't really afford to wait 10 to 20 years to have good ice sheet models to tell people, 'Well, sea level is actually going to rise 2 metres and not 50 centimetres', because the consequences are very significant, and things will be pretty much locked in at that point."

So climate scientists are looking for other ways to predict sea level rise. Rahmstorf, for instance, is treating the Earth as one big black box. His starting point is the simple idea that the rate of sea level rise is proportional to the increase in temperature: the warmer Earth gets, the faster ice melts and the oceans expand. This held true for the last 120 years at least. "There is a very close and statistically highly significant correlation between the rate of sea level rise and the temperature increase above the pre-industrial background level," says Rahmstorf.

Extrapolating this to the future, based on IPCC emissions scenarios, suggests sea level will rise by between 0.5 and 1.4 m -- and the higher estimate is more likely because emissions have been rising faster than the IPCC's worst-case scenario. Rahmstorf's study got a mixed reception when it first appeared, but he can feel the winds of change. "I sense that now a majority of sea level experts would agree with me that the IPCC projections are much too low," he says.

Could even Rahmstorf's estimate be too low? It assumes the relation between temperature and sea level is linear, but some experts, most prominently James Hansen of NASA's Goddard Institute for Space Studies in New York, argue that because there are multiple positive feedbacks, such as the lubrication of glaciers by meltwater, higher temperatures will lead to accelerating ice loss. "Why do I think a sea level rise of metres would be a near certainty if greenhouse gas emissions keep increasing?" Hansen wrote in New Scientist (28 July 2007, p 30). "Because while the growth of great ice sheets takes millennia, the disintegration of ice sheets is a wet process that can proceed rapidly."

Hansen has made no specific prediction, however. So just how bad could it get? Tad Pfeffer of the University of Colorado in Boulder decided to work backwards from some of the worst-case scenarios: 2 m by 2100 from Greenland, and 1.5 m from West Antarctica, via the Pine Island and Thwaites glaciers. Just how fast would the glaciers have to be moving for the sea level to rise by these amounts? Pfeffer found that glaciers in Greenland would need to move at 70 km/year, and Pine Island and Thwaites glaciers at 50 km/year, from now until 2100. Since most glaciers are moving at just a few kilometres per year, to Pfeffer and many others, these numbers seem highly unrealistic.

Worst case

So what is possible? For scenarios based on conservative assumptions, such as a doubling of glacier speeds, Pfeffer found sea level will rise by around 80 cm by 2100, including thermal expansion. "For the high end, we took all of the values we could change and we pushed them forward to the largest numbers we imagined would be reasonable," says Pfeffer. The answer: 2 metres.

These estimates fit well with recent studies of comparable periods in the past, which have found that sea level rise averaged up to 1.6 m per century at times. There is a huge caveat in Pfeffer's number crunching, though. "An important assumption we made is that the rest of West Antarctica stays put. And this is the part of West Antarctica that is held behind the Ross ice shelf and the Ronne ice shelf," says Pfeffer. "Those two ice shelves are very big, and very thick, and very cold. We don't see a way to get rid of those in the next century."

Holland is not so sure. He has been studying computer models of ocean currents around Antarctica, and he doesn't like what he sees. The subsurface current of warm water near the frozen continent, known as the circumpolar deep water, branches near the coast, and one branch hits Pine Island -- which is probably why the ice there is thinning and speeding up. "Another branch of it comes ever so close to the Ross ice shelf," says Holland. "In some computer simulations of the future, the warm branch actually goes and hits Ross."

While it is impossible to predict exactly what will cause this, the lessons from Jakobshavn show that a small change in the wind patterns over Antarctica might be enough to shift the warm current towards and eventually underneath the Ross ice shelf. Then even this gigantic mass of ice -- about the size of France -- becomes vulnerable, regardless of how cold the air above it is. Pfeffer agrees that the Ross and Ronne ice shelves are the wild cards. "If we pull the plug on those two, then we create a very different world."

Is there really a danger of a collapse, which would cause a sudden jump in sea levels? Paul Blanchon's team at the National Autonomous University of Mexico in Cancun has been studying 121,000-year-old coral reefs (pictured above) in the Yucatan Peninsula, formed during the last interglacial period when sea level peaked at around 6 ms higher than today. His findings suggest that at one point the sea rose 3 m within 50-100 years.

We just don't know if this could happen again in the 21st century. What is clear, though, is that even the lowest, most conservative estimates are now higher than the IPCC's highest estimate. "Most of my community is comfortable expecting at least a metre by the end of this century," says Bindschadler.

Most glaciologists who study Greenland and Antarctica are expecting at least a metre rise by the end of the century

And it will not stop at a metre. "When we talk of sea level rising by 1 or 2 metres by 2100, remember that it is still going to be rising after 2100," Rignot warns.

All of which suggests we might want to start preparing. "People who are trying to downplay the significance say, 'Oh, the Earth has gone through changes much greater than this, you know, in the geological past'," says Pfeffer. "That's true, but it's completely irrelevant. We weren't there then."

What it all means

If a one-metre rise in sea level doesn't sound like much, consider this: about 60 million people live within one metre of mean sea level, a number expected to grow to about 130 million by 2100.

Much of this population lives in the nine major river deltas in south and southeast Asia. Parts of countries such as Bangladesh, along with some island nations like the MaldivesMovie Camera, will simply be submerged.

According to a 2005 report, a one-metre rise in sea level will affect 13 million people in five European countries and destroy property worth $600 billion, with the Netherlands the worst affected. In the UK, existing defences are insufficient to protect parts of the east and south coast, including the cities of Hull and Portsmouth.

Besides inundation, higher seas raise the risk of severe storm surges and dangerous flooding. The entire Atlantic seaboard of North America, including New York, Boston and Washington DC, and the Gulf coast will become more vulnerable to hurricanes. Today's 100-year storm floods might occur as often as every four years -- in which case it will make more sense to abandon devastated regions and towns than to keep rebuilding them.

Anil Ananthaswamy is a contributing editor for New Scientist

Link: http://www.newscientist.com/article/mg20327151.300-sea-level-rise-its-worse-than-we-thought.html?full=true

Ministers get close look at Antarctic ice threat at Norway's Troll Research Station

Ministers get close look at Antarctic ice threat

TROLL RESEARCH STATION, Antarctica, Monday, 23 February 2009 08:53:44
by CHARLES J. HANLEY - AP Special Correspondent

A parka-clad band of environment ministers landed in this remote corner of the icy continent on Monday, in the final days of an intense season of climate research, to learn more about how a melting Antarctica may endanger the planet.

Representatives from more than a dozen nations, including the U.S., China, Britain and Russia, were to rendezvous at a Norwegian research station with American and Norwegian scientists coming in on the last leg of a 1,400-mile (2,300-kilometer), two-month trek over the ice from the South Pole.

The visitors will gain "hands-on experience of the colossal magnitude of the Antarctic continent and its role in global climate change," said the mission's organizer, Norway's Environment Ministry.

They'll also learn about the great uncertainties plaguing research into this southernmost continent and its link to global warming: How much is Antarctica warming? How much ice is melting into the sea? How high might it raise ocean levels worldwide?

The answers are so elusive that the Intergovernmental Panel on Climate Change (IPCC), a Nobel Prize-winning U.N. scientific network, excluded the potential threat from the polar ice sheets from calculations in its authoritative 2007 assessment of global warming.

The IPCC forecast that oceans may rise up to 23 inches (0.59 meters) this century, from heat expansion and melting land ice, if the world does little to reduce emissions of carbon dioxide and other greenhouse gases blamed for atmospheric warming.

But the U.N. panel did not take Antarctica and Greenland into account, since the interactions of atmosphere and ocean with their enormous stores of ice (Antarctica has 90% of the world's ice) are poorly understood. And yet the West Antarctic ice sheet, some of whose outlet glaciers are pouring ice at a faster rate into the sea, "could be the most dangerous tipping point this century," says a leading U.S. climatologist, NASA's James Hansen.

"There is the potential for several-meter rise of sea level," Hansen told The Associated Press last week. The scenario is "frightening," says the IPCC's chief scientist, Rajendra Pachauri, who met with the ministers in Cape Town before their nine-hour flight here from South Africa.

Finding the answers has been key to the 2007-2009 International Polar Year (IPY), a mobilization of 10,000 scientists and 40,000 others from more than 60 countries engaged in intense Arctic and Antarctic research over the past two southern summer seasons -- on the ice, at sea, via icebreaker, submarine and surveillance satellite.

The 12-member Norwegian-American Scientific Traverse of East Antarctica (the trekkers "coming home" to Troll) was an important part of that work, having drilled deep cores into the annual layers of ice sheet in this little-explored region to determine how much snow has fallen historically and its composition.

Such work will be combined with another IPY project (an all-out effort to map by satellite radar the "velocity fields" of all Antarctic ice sheets over the past two summers) to assess how fast ice is being pushed into the surrounding sea.

Then scientists may understand better the "mass balance" i.e., how much the snow, originating from ocean evaporation, is offsetting the ice pouring seaward.

"We're not sure what the East Antarctic ice sheet is doing," David Carlson, IPY director, explained last week from the program's offices in Cambridge, England. "It looks like it is flowing a little faster. So is that matched by accumulation? What they come back with will be crucial to understanding the process."

The visiting environment ministers were those of Algeria, Britain, Congo, the Czech Republic, Finland, Norway and Sweden. Other countries were represented by climate policymakers and negotiators, including Xie Zhenhua of China and Dan Reifsnyder, a deputy assistant U.S. secretary of state.

During their long day here under the 17-hour sunlight of a dying southern summer, when temperatures still drop to near zero Fahrenheit (-20 °C), the northern visitors took in the awesome sights of Queen Maud Land, a forbidding, mountainous icescape 3,000 miles (5,000 kilometers) southwest of South Africa, and toured the Norwegians' high-tech Troll Research Station, upgraded to year-round operations in 2005.

The politics of climate inevitably mixed with the science. Stranded in Cape Town an extra two days when high Antarctic winds scrubbed a planned weekend flight, the ministers were gently lobbied at lunch and dinner by Scandinavian counterparts favoring urgent action on a new global agreement to succeed the Kyoto Protocol, the deal to reduce greenhouse gases that expires in 2012.

U.S. President Barack Obama's new administration has promised action after years of U.S. resistance to the Kyoto process. But the complexity of issues and limited time before a Copenhagen conference in December, target date for a deal, make the outcome as uncertain as the future of Antarctica's glaciers and offshore ice shelves.

Much more research lies ahead, say the scientists, including investigations of the possible warming and shifting currents of the Southern Ocean ringing Antarctica. "We need to put more resources in," said IPY's Carlson.

Outspoken scientists say political action may be even more urgently needed.

"We are out of our cotton-pickin' minds if we let that process get started," Hansen said of an Antarctic meltdown. "Because there will be no stopping it."

Link to article: http://www.esearchnet.com/news/article/view/oc/1106/did/D96H685O0

Andrew Glikson: Antarctic blues and the Australian drought

Antarctic blues and the Australian drought

Antarctic blues and the Australian drought
Andrew Glikson
Earth and paleo-climate scientist
Australian National University

The Antarctic ice sheet has not always been there.

The ice began to form about 34 million years ago, by the late Eocene, when the Antarctic continent (Fig. 1) became isolated through the opening of the Drake Passage between the Antarctic peninsula and southern tip of South America, restricting access of warm currents, and when global carbon dioxide levels decreased to below 450 parts per million CO2, decreasing the mean temperature of Earth by near -6 °C [1].

Fig. 1. The Antarctic continent from space

The current global rise in atmospheric CO2 levels to 387 ppm (over 400 ppm-e radiative equivalent of CO2 + CH4 + N2O) ensues in warming of the Antarctic ice, in particular of western Antarctica, and of the Antarctic peninsula (Fig. 2). It further reduces concentration of circum-Antarctic sea ice (Fig. 3). Another expression of warming is the accelerating movement of glaciers, where the mass of the ice sheet decreased significantly at a rate of 152 ± 80 cubic kilometers of ice per year [2].

Based on a combination of ground stations and satellite observations, NASA/GISS reports a mean temperature increase of +0.12 °C per decade for the entire continent of Antarctica, and +0.17 °C per decade for western Antarctica, during 1957-2006 (NASA, 21.1.2009) (Fig. 2). Manifestations of warming include reduced concentration of sea ice around parts of Antarctica (Fig. 3) and the disintegration of ice shelves (Fig. 4) due to the effect of warming seas. In particular, the part of western Antarctica which overlies sub-sea level basement is vulnerable to sea water-induced melting. While most of the peripheral near-coastal zones of west and east Antarctica display various degrees of warming and glacier melt, a small area in east Antarctica have been cooling, a likely result of ozone depletion above Antarctica, ozone being a greenhouse gas, as well as acceleration and wind-chill effect of the Antarctic wind vortex (Fig. 5).

Fig. 2. NASA Goddard Institute of Space Science, 21.1.2009. Satellite and ground station data confirm 50 years of west Antarctica warming. Values in °C over 50 years

Fig. 3. Sea ice per cent concentration trends in the Arctic Sea and around Antarctica for October 2008 relative to 1979-2000 October monthly average. National Snow and Ice Data Center.

Regional changes in atmospheric circulation and associated changes in sea surface temperature and sea ice are required to explain the enhanced warming in Western Antarctica [3]. Breakup of ice shelves is exemplified by the Wilkins ice shelf (Fig. 4), which for the first time continued to breakdown during winter (June-July) 2008 [4].

Fig. 4. Satellite images shows the Wilkins Ice Shelf as it began to break up. The large image is from March 6; the images at right, from top to bottom, are from February 28, February 29, and March 8. NSIDC processed these images from the NASA Moderate Resolution Imaging Spectroradiometer (MODIS) sensor, which flies on NASA’s Earth Observing System Aqua and Terra satellites.

The southward migration of climate zones by nearly 400 km and the retreat of the Antarctic wind vortex (Fig. 5) have combined to increase drought conditions in southern Australia. In the last thirty years, a 20% loss of the average rainfall along Australia's southern fringe occurred, marked by sudden drops in rainfall in southwestern Australia in the 1970s, and in Victoria in the 1990s, affecting agriculture and reservoir supplies for more than six million people [5]. The consequences in terms of maximum temperature rise (Fig. 6A), rainfall variations (Fig. 6B), and extreme heat wave conditions (Fig. 6C) are evident.

Figure 5. The Antarctic wind vortex viewed from the Galileo spacecraft. As climate zones migrate toward the poles, the southward contraction of the swirling cold moist fronts results in reduced rainfall over southern Australia.

Loss of Antarctic ice shelves and ice sheets, indicated by time variable gravity show mass loss [2] threatens to raise sea levels on the scale of many metres, leading to inundation of coastal regions, deltas, and low river valleys around the world (Fig. 7). Melting of western Antarctic ice would raise sea levels by nearly 7 metres, whereas melting of the entire Antarctic ice sheet would raise sea levels by some 70 metres, returning the Earth to pre-late Eocene conditions (Fig. 6).

Figure 6A. Australia maximum temperature variations in °C per 10 years, 1970-2008 (Australian Bureau of Meteorology).

Figure 6B. Australia annual total rainfall variations in mm per 10 years, 1970-2008 (Australian Bureau of Meteorology).

Figure 6C. Maximum temperatures for Australia, 7 February 2009. Australian Bureau of Meteorology.

Fig. 7. Projected sea level rise (Hansen, 2007). The color bars represent topographic elevations in metres. Sea level rise by up to 25 metres (Greenland and western Antarctic ice melt) is represented in blues, and up to 75 metres (total Antarctic melt) in yellow.

Until recently, whenever climate research organizations reported increases in Arctic Sea ice melt rates [6], advocates of global “cooling” have been making references to the Antarctic continent as a supposed counter argument [7]. Referring to small, stable or slightly cooling parts of east Anarctica (Fig 2), a plethora of bogus climate websites claims Antarctic warming is not a part of global warming [8].

Presumably regarding Antarctica as part of another planet?

Nor do “climate skeptics” shed too many tears about Emperor penguins, the magnificent birds which have to migrate from their inland colonies across ice shelves and sea ice (Fig. 8), where the females lay just one egg that is tended by the male. The ice plays a major role in their overall breeding success. Further, the extent of sea ice cover influences the abundance of krill and the fish species that eat them – both food sources for the penguins.

Misreadings of climate science by “climate skeptics” have delayed efforts at climate mitigation by at least 20 years. In the words of Clive Hamilton [9]: “If scientific advances cause scientists to reject the conclusions of past IPCC reports … not much harm will be done. … but if … fellow skeptics were successful in stopping policies to cut emissions and the IPCC projections turn out to be correct, then environmental catastrophe will follow and millions of people will die. Do they lose sleep over this? Do they worry about how their grandchildren will see them? Or are they so consumed by the crusade that they know they will never be proven wrong?”

Fig. 8. Melting Antarctic iceberg.

References

Link to this article: http://webdiary.com.au/cms/?q=node/2725

Latest research on Antarctic warming explained by Eric Steig on RealClimate

State of Antarctica: red or blue?

RealClimate, 21 January 2009

— eric @ 1:10 PM

A couple of us (Eric and Mike) are co-authors on a paper coming out in Nature this week (Jan. 22, 09). We have already seen misleading interpretations of our results in the popular press and the blogosphere, and so we thought we would nip such speculation in the bud.

The paper shows that Antarctica has been warming for the last 50 years, and that it has been warming especially in West Antarctica (see the figure). The results are based on a statistical blending of satellite data and temperature data from weather stations. The results don't depend on the statistics alone. They are backed up by independent data from automatic weather stations, as shown in our paper as well as in updated work by Bromwich, Monaghan and others (see their AGU abstract, here), whose earlier work in JGR was taken as contradicting ours. There is also a paper in press in Climate Dynamics (Goosse et al.) that uses a GCM with data assimilation (and without the satellite data we use) and gets the same result. Furthermore, speculation that our results somehow simply reflect changes in the near-surface inversion is ruled out by completely independent results showing that significant warming in West Antarctica extends well into the troposphere. And finally, our results have already been validated by borehole thermometery — a completely independent method — at at least one site in West Antarctica (Barrett et al. report the same rate of warming as we do, but going back to 1930 rather than 1957; see the paper in press in GRL).

Here are some important things the paper does NOT show:

1) Our results do not contradict earlier studies suggesting that some regions of Antarctica have cooled. Why? Because those studies were based on shorter records (20-30 years, not 50 years) and because the cooling is limited to the East Antarctic. Our results show this too, as is readily apparent by comparing our results for the full 50 years (1957-2006) with those for 1969-2000 (the dates used in various previous studies), below.

2) Our results do not necessarily contradict the generally-accepted interpretation of recent East Antarctic cooling put forth by David Thompson (Colorado State) and Susan Solomon (NOAA Aeronomy Lab). In an important paper in Science, they presented evidence that this cooling trend is linked to an increasing trend in the strength of the circumpolar westerlies, and that this can be traced to changes in the stratosphere, mostly due to photochemical ozone losses. Substantial ozone losses did not occur until the late 1970s, and it is only after this period that significant cooling begins in East Antarctica.

3) Our paper — by itself — does not address whether Antarctica's recent warming is part of a longer term trend. There is separate evidence from ice cores that Antarctica has been warming for most of the 20th century, but this is complicated by the strong influence of El Niño events in West Antarctica. In our own published work to date (Schneider and Steig, PNAS), we find that the 1940s [edit for clarity: the 1935-1945 decade] were the warmest decade of the 20th century in West Antarctica, due to an exceptionally large warming of the tropical Pacific at that time.

So what do our results show? Essentially, that the big picture of Antarctic climate change in the latter part of the 20th century has been largely overlooked. It is well known that it has been warming on the Antarctic Peninsula, probably for the last 100 years (measurements begin at the sub-Antarctic Island of Orcadas in 1901 and show a nearly monotonic warming trend). And yes, East Antarctica cooled over the 1980s and 1990s (though not, in our results, at a statistically significant rate). But West Antarctica, which no one really has paid much attention to (as far as temperature changes are concerned), has been warming rapidly for at least the last 50 years.

Why West Antarctica is warming is just beginning to be explored, but in our paper we argue that it basically has to do enhanced meridional flow — there is more warm air reaching West Antarctica from farther north (that is, from warmer, lower latitudes). In the parlance of statistical climatology, the "zonal wave 3 pattern" has increased (see Raphael, GRL 2004). Something that goes along with this change in atmospheric circulation is reduced sea ice in the region (while sea ice in Antarctica has been increasing on average, there have been significant declines off the West Antarctic coast for the last 25 years, and probably longer). And in fact this is self reinforcing (less sea ice, warmer water, rising air, lower pressure, enhanced storminess).

The obvious question, of course, is whether those changes in circulation are themselves simply "natural variability" or whether they are forced — that is, resulting from changes in greenhouse gases. There will no doubt be a flurry of papers that follow ours, to address that very question. A recent paper in Nature Geosciences by Gillet et al. examined trends in temperatures in the both Antarctic and the Arctic, and concluded that "temperature changes in both … regions can be attributed to human activity." Unfortunately our results weren't available in time to be made use of in that paper. But we suspect it will be straightforward to do an update of that work that does incorporate our results, and we look forward to seeing that happen.

Postscript
Some comment is warranted on whether our results have bearing on the various model projections of future climate change. As we discuss in the paper, fully-coupled ocean-atmosphere models don't tend to agree with one another very well in the Antarctic. They all show an overall warming trend, but they differ significantly in the spatial structure. As nicely summarized in a paper by Connolley and Bracegirdle in GRL, the models also vary greatly in their sea ice distributions, and this is clearly related to the temperature distributions. These differences aren't necessarily because there is anything wrong with the model physics (though schemes for handling sea ice do vary quite a bit model to model, and certainly are better in some models than in others), but rather because small differences in the wind fields between models results in quite large differences in the sea ice and air temperature patterns. That means that a sensible projection of future Antarctic temperature change — at anything smaller than the continental scale — can only be based on looking at the mean and variation of ensemble runs, and/or the averages of many models. As it happens, the average of the 19 models in AR4 is similar to our results — showing significant warming in West Antarctica over the last several decades (see Connolley & Bracegirdle's Figure 1).

A comment and response:

  1. Steve D. Says:

    On many occasions on this site it’s been said that cooling in Antartica is consistent with AGW, as the models show etc…. Now it appears that a warming Antarctica is also consistent with AGW. I am curious to know, is there any kind of change in temperature down there which would invalidate the AGW thesis?

    [Response:Why do the critics think that everything is so simple and binary, for example that we can lump all anthropogenic forcings into a simple “AGW” forcing. Guess what, its not that simple. There are multiple anthropogenic forcings that have quite different impacts (e.g. anthropogenic greenhouse gas increases, aerosols, land-use changes and, yes, stratospheric ozone depletion). Anyone who follows the science is of course aware of this. The temperature trends in Antarctica depend on the time interval and season one looks at, because certain forcings, such as ozone depletion, are particularly important over restricted past time intervals and during particular seasons. The interval over which we expect cooling of the interior is when ozone depletion was accelerating (1960s through late 20th century) and this is precisely when we reproduce the cooling trend both in the reconstruction (primarily during the Austral fall season) and the model simulation experiments discussed in the paper. Over the longer-term, and in the annual mean, greenhouse warming wins out over the more temporary and seasonally-specific impacts of ozone depletion in our simulations, and apparently in the real world. Do you really think that all of the authors and reviewers would have overlooked a basic internal contradiction of logic of the sort you imply, if it actually existed? This is all discussed in detail in the paper. Why not go to your local library and read it and perhaps learn something? -mike]


Link to RealClimate blog post: http://www.realclimate.org/index.php/archives/2009/01/state-of-antarctica-red-or-blue/

Eric J. Steig et al., Warming of the Antarctic ice-sheet surface since the 1957 International Geophysical Year

Letter

Nature 457, 459-462 (22 January 2008) | doi:10.1038/nature07669; Received 14 January 2008; Accepted 1 December 2008

Warming of the Antarctic ice-sheet surface since the 1957 International Geophysical Year

Eric J. Steig1, David P. Schneider2, Scott D. Rutherford3, Michael E. Mann4, Josefino C. Comiso5 & Drew T. Shindell6

  1. Department of Earth and Space Sciences and Quaternary Research Center, University of Washington, Seattle, WA 98195, USA
  2. National Center for Atmospheric Research, Boulder, CO 80307, USA
  3. Department of Environmental Science, Roger Williams University, Bristol, RI, USA
  4. Department of Meteorology, and Earth and Environmental Systems Institute, Pennsylvania State University, University Park, PA 16802, USA
  5. NASA Laboratory for Hydrospheric and Biospheric Sciences, NASA Goddard Space Flight Center, Greenbelt, MD 20771, USA
  6. NASA Goddard Institute for Space Studies and Center for Climate Systems Research, Columbia University, New York, NY 10025, USA

Correspondence and requests for materials: Eric J. Steig1 (e-mail: steig@ess.washington.edu)

Assessments of Antarctic temperature change have emphasized the contrast between strong warming of the Antarctic Peninsula and slight cooling of the Antarctic continental interior in recent decades1. This pattern of temperature change has been attributed to the increased strength of the circumpolar westerlies, largely in response to changes in stratospheric ozone2. This picture, however, is substantially incomplete owing to the sparseness and short duration of the observations. Here we show that significant warming extends well beyond the Antarctic Peninsula to cover most of West Antarctica, an area of warming much larger than previously reported. West Antarctic warming exceeds 0.1 °C per decade over the past 50 years, and is strongest in winter and spring. Although this is partly offset by autumn cooling in East Antarctica, the continent-wide average near-surface temperature trend is positive. Simulations using a general circulation model reproduce the essential features of the spatial pattern and the long-term trend, and we suggest that neither can be attributed directly to increases in the strength of the westerlies. Instead, regional changes in atmospheric circulation and associated changes in sea surface temperature and sea ice are required to explain the enhanced warming in West Antarctica.

Link to abstract: http://www.nature.com/nature/journal/v457/n7228/full/nature07669.html

C. W. Böning et al., The response of the Antarctic Circumpolar Current to recent climate change

Nature Geoscience, 1 (2008) 864-869.
Published online: 23 November 2008 | doi:10.1038/ngeo362

The response of the Antarctic Circumpolar Current to recent climate change

C. W. Böning1, A. Dispert1, M. Visbeck1, S. R. Rintoul2 & F. U. Schwarzkopf1

Observations show a significant intensification of the Southern Hemisphere westerlies, the prevailing winds between the latitudes of 30° and 60° S, over the past decades. A continuation of this intensification trend is projected by climate scenarios for the twenty-first century. The response of the Antarctic Circumpolar Current (ACC) and the carbon sink in the Southern Ocean to changes in wind stress and surface buoyancy fluxes is under debate. Here we analyse the Argo network of profiling floats and historical oceanographic data to detect coherent hemispheric-scale warming and freshening trends that extend to depths of more than 1,000 m. The warming and freshening is partly related to changes in the properties of the water masses that make up the ACC, which are consistent with the anthropogenic changes in heat and freshwater fluxes suggested by climate models. However, we detect no increase in the tilt of the surfaces of equal density across the ACC, in contrast to coarse-resolution model studies. Our results imply that the transport in the ACC and meridional overturning in the Southern Ocean are insensitive to decadal changes in wind stress.

  1. Leibniz-Institut für Meereswissenschaften (IFM-GEOMAR), Düsternbrooker Weg 20, 24105 Kiel, Germany
  2. Centre for Australian Weather and Climate Research—a partnership of the Bureau of Meteorology and CSIRO, Wealth from Oceans Flagship, and the Australian Climate and Ecosystems Cooperative Research Centre, Hobart, Tasmania 7000, Australia

Correspondence to: C. W. Böning1 e-mail: cboening@ifm-geomar.de

Link to abstract: http://www.nature.com/ngeo/journal/v1/n12/abs/ngeo362.html

John C. Fyfe et al., Journal of Climate, Vol. 20, No. 21, 2007: Role of Poleward-Intensifying Winds of Southern Ocean Warming

Journal of Climate, Vol. 20, Issue 21 (Nov. 2007) 5391-5400, DOI: 10.1175/2007JCLI1764.1

The Role of Poleward-Intensifying Winds on Southern Ocean Warming

John C. Fyfe and Oleg A. Saenko

Canadian Centre for Climate Modelling and Analysis, Environment Canada, Victoria, British Columbia, Canada

Kirsten Zickfeld, Michael Eby, and Andrew J. Weaver

School of Earth and Ocean Sciences, University of Victoria, Victoria, British Columbia, Canada

(Manuscript received 8 November 2006, in final form 9 March 2007)

ABSTRACT

Recent analyses of the latest series of climate model simulations suggest that increasing CO2 emissions in the atmosphere are partly responsible for (i) the observed poleward shifting and strengthening of the Southern Hemisphere subpolar westerlies (in association with shifting of the southern annular mode toward a higher index state), and (ii) the observed warming of the subsurface Southern Ocean. Here the role that poleward-intensifying westerlies play in subsurface Southern Ocean warming is explored. To this end a climate model of intermediate complexity was driven separately, and in combination with, time-varying CO2 emissions and time-varying surface winds (derived from the fully coupled climate model simulations mentioned above). Experiments suggest that the combination of the direct radiative effect of CO2 emissions and poleward-intensified winds sets the overall magnitude of Southern Ocean warming, and that the poleward-intensified winds are key in terms of determining its latitudinal structure. In particular, changes in wind stress curl associated with poleward-intensified winds significantly enhance pure CO2-induced subsurface warming around 45°S (through increased downwelling of warm surface water), reduces it at higher latitudes (through increased upwelling of cold deep water), and reduces it at lower latitudes (through decreased downwelling of warm surface water). Experiments also support recent high-resolution ocean model experiments suggesting that enhanced mesoscale eddy activity associated with poleward-intensified winds influences subsurface (and surface) warming. In particular, it is found that increased poleward heat transport associated with increased mesoscale eddy activity enhances the warming south of the Antarctic Circumpolar Current. Finally, a mechanism involving offshore Ekman sea ice transport (modulated by enhanced mesoscale activity) that acts to significantly limit the human-induced high-latitude Southern Hemisphere surface temperature response is reported on.

Link to abstract: http://ams.allenpress.com/perlserv/?request=get-abstract&doi=10.1175%2F2007JCLI1764.1