Showing posts with label Mauri Pelto. Show all posts

Humboldt Glacier Retreat, Greenland, by Mauri Pelto, From A Glacier's Perspective

Humboldt Glacier Retreat, Greenland

Humboldt Glacier in northwest Greenland terminates in a 100-km-wide calving front in the sea. This is the longest such calving front in Greenland, capturing our imagination for potential havoc. The lack of confining topography prevents the development of the strong ice stream flow we see on Jakobshavn Glacier or the weaker ice stream flow of Petermann Glacier and its subsequent long floating tongue. Humboldt Glacier’s unique calving front leads to a different set of feedbacks to climate change that are worth examining. Pelto and Warren (1991) (Do not laugh at my figures in that paper, that is back in the drafted with ink days) noted that water depth at the calving front even in the case of polar or floating tongues provides a good estimate of calving velocity. More than width we then need to look at the water depth at the front for answers.

Below is Humboldt Glacier in 2008 from a NASA image. The active portion of the terminus begins above the tag on the image 2000 approximate terminus position.


From when observed by Koch in 1912-1913, the glacier changed little over the next 60 years. The glacier is a principal source of icebergs to the Kane Basin. Generally the icebergs are tabular icebergs less than 1 km in their largest diameter. Most icebergs come from the northern portion of the calving front is fed by an active ice stream, a nice view of these is from Jason Box at OSU. The glacier has lost 200 square kilometers of area since 1982, mostly since 2000, including this summer’s losses. What is particularly noteworthy is the amount of eroded sediment raising the turbidity and color of the water to that of coffee at the calving front in 2009 in the images from Jason Box and of Nick Cobbing of Greenpeace. This is indicative of where major subglacial
meltwater streams enter the ocean.

.

To understand the dynamics of Humboldt Glacier its pattern of velocity, ice thickness and ice bed depths need to be identified. Ian Joughin et al (2010) provide a detailed velocity map of Petermann and Humboldt Glacier shown below. The Petermann is the narrower tongue flowing towards the top, Humboldt to the left. The velocity does not exceed 80 m/year in the southern half of the calving front. The northern portion increases from 80 m/year at the equilibrium line to 200-300 m/year at the calving front. The low velocity of the southern half of the terminus indicates a terminus that is firmly grounded, not just at the glacier front, but also all along the flowline.


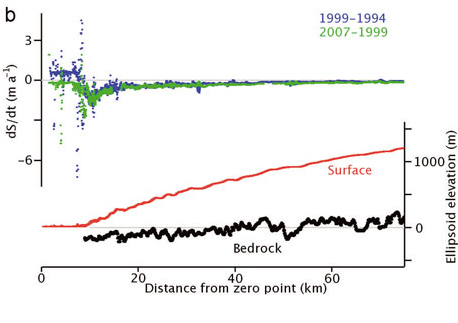
The basal topography and surface topography of the ice sheet was captured by Thomas et al (2009). The graph below indicates that the bed is generally below sea level for 40 km inland of the calving front. The bed is not smooth. The bed is not deep, usually less than 200 m. The result is that ice less than 240 m thick cannot be afloat. The lack of smoothness and lack of a trough penetrating deep into the ice sheet indicates the lack of streaming flow dynamics that would erode and smooth such a channel. Behind the calving front the glacier slope is quite low the surface not reaching 1000 m until 60 km back of the calving front. In this span there is no specific bench of higher elevation either. The snowline, evident in the image below, on this glacier tends to be at 600 m. This is only 40-45 km inland from the calving front, compared to the 80 km long ablation zone on Petermann Glacier. There are three dotted lines I have added to this image. The first nearest the calving front indicates a clear zone of surface roughness that has to reflect the glacier is grounded and passing over a bedrock knob of sorts. The second is the transient snow line for that day. The third is the ela. Note the slightly wider distance to the ela on the north side indicating the lower slope and deeper bed that promotes the higher velocities in the area. One would anticipate an expansion of the calving embayment in the area where the embayment exists today, with retreat occuring mainly in this section. The size of the tabular bergs argues that at least locally the glacier is close to being afloat or is afloat at least sometimes during the tidal cycle.


We have a comparatively slow moving, not particularly thick, but wide glacier. The glacier does not have a deep bed penetrating to the core of the ice sheet. The volume produced by Humboldt compared to Jakobshavn and Petermann puts it in perspective. Jakobshavn annual flux 40 km3 (flux = annual depth average velocity x width x mean depth). Petermann Glacier has close to 12 km³ at the grounding line, but less than 1 km³ reaches the calving front, after all the melting along the ice tongue. With a shorter ice tongue the calving flux should rise.. Humboldt Glacier is closer to 4 km³. Helheim Glacier has been assessed at 26 km³.

Thus, though the Humboldt Glacier has a magnificent and impressive front and taps into the core of the northwest corner of the ice sheet. It does not at present have the ability to discharge ice at volumes comparable to Jakobshavn or Helheim. The glacier does not have either a large floating section or a large ice stream section that lends itself to large rapid retreat or acceleration. The recent history of area and volume loss noted by Box indicates this glacier is more prone to a steadier progressive loss than many other outlet glaciers. The glacier continues to produce an impressive volume of icebergs as seen in the Nick Cobbing image below.


The depth at the calving front is a key variable and provides a good first estimate of average calving velocity. In the Pelto and Warren (1991) study, four other polar glaciers have water depths that are in the vicinity of 100 m and have velocites at the calving front of 100-300 m/year. Humboldt fits this pattern. For Humboldt the relatively shallow water today across most of the front and in the future, noting depths behind the front, indicates the velocity of this glacier will remain comparatively low. Even the northern section has a limited section of higher velocity in width (25 km greater than 200 m) and distance inland from the ice front (50 km maximum). This region is centered on the main calving embayment. The northern margin is again well grounded.


Thanks to Neven and Pat Lockerby for all the inspiring arctic image work this year.

Link:  http://glacierchange.wordpress.com/2010/09/04/humboldt-glacier-retreat-greenland/

GlacierChange comments on Michael Tobis' Tom Fuller post

This is a well-deserved go-off on Tom Fuller from the Only In It For The Gold comment section, but it is so chock full of information and links on current trends in several important glaciers, that I thought it expedient to post it here (thank you, MP).
glacierchange said...
What a relief T.Fuller informs us that the GIS is not going anywhere. I guess we do not need to spend all this time working on the GIS, I could have put some of those summers to better use. I do not need to worry about the acceleration of Rinks, Jakobshavn, Leidy, Helheim, Kangerlussuaq, Tracy, Academy, Alison, Steenstrup, Nansen, Upernavik, Umiamako, Store, Narssap, Kong Christian IV, Zacharaie etc. All that have accelerated. This is not the mechanical change in one glacier. Or the changes due to melt induced thinning on Petermann Glacier. The volume loss on Humboldt Glacier.We can also ignore that we understood this acceleration would come and why in the 1980s, just did not know when RC-Jakobshavn . And volume losses from GIS glaciers And that does not even get to Pine Island Glacier where again the mechanics were understood some thirty years ago and now what was predicted is occurring due to warming at the grounding line. Wait all that evidence says I do need to worry. And that the scientists were correct.Link:  http://initforthegold.blogspot.com/2010/09/ingrate.html

Mauri Pelto on Real Climate: Is Pine Island Glacier the Weak Underbelly of the West Antarctic Ice Sheet?

Is Pine Island Glacier the Weak Underbelly of the West Antarctic Ice Sheet?

— eric @ 9 November 2009:  Guest post by Mauri Pelto on Real Climate

AntarcMapPelto 
It is popularly understood that glaciologists consider West Antarctica the biggest source of uncertainty in sea level projections. The base of the 3000-m thick West Antarctic Ice Sheet (WAIS) – unlike the much larger East Antarctic Ice Sheet – lies below sea level, and it has been recognized for a long time that this means it has the potential to change very rapidly. Most of the grounded West Antarctic ice sheet drains into the floating Ross and Ronne-Filchner ice shelves, but a significant fraction also drains into the much smaller Pine Island Glacier. Glaciologists are paying very close attention to Pine Island Glacier (”PIG” on map, right) and nearby Thwaites Glacier. In the following guest post, Mauri Pelto explains why.

In science there are instances when a specific mechanism is understood and a hypothesis posed based on an understanding of the processes involved, prior to the initiation or observation of the those processes. An excellent example is the determination by Molina and Rowland (1974) that CFC’s will lead to losses in stratospheric ozone. The full truth of their understanding of the process was not revealed until the Antarctic ozone hole was reported in 1985 by Farman et al.

A different example, from the same time period, was the 1978 publication by the late John Mercer, Ohio State U., who argued that a major deglaciation of the West Antarctic Ice Sheet (WAIS) may be in progress within 50 years. This conclusion was based on the fact that the WAIS margin was ringed with stabilizing ice shelves, and that much of the ice sheet is grounded below sea level. The loss of ice shelves — Mercer proposed — would allow the ice sheet to thin, grounding lines to retreat and the ice sheet to disintegrate via calving. This is a much faster means of losing mass than melting in place. Mercer further commented that the loss of ice shelves on the Antarctic Peninsula, as has since been observed, would be an indicator that this process of ice sheet loss due to global warming was underway.

Mercer’s ideas led Terry Hughes (1981) (my doctoral advisor at U. of Maine) to propose that the WAIS had a “weak underbelly” in Pine Island Bay. This bay in the Amundsen Sea is where the Pine Island Glacier (PIG) and Thwaites Glacier reach the sea. These are the only two significant outlet glaciers draining the north side of the WAIS. Together they drain 20% of the WAIS. Hughes called this area the “weak underbelly” because these glaciers lack the really huge ice shelves Ross Ice Shelf and the Ronne-Filchner Ice Shelf in which most other large WAIS outlet glaciers terminate. Both glaciers have a relatively rapid flow from the WAIS interior to the calving margin. Further the low surface slopes and smooth flow patterns of PIG suggested to Hughes that there was no indication of a landward rise in the elevation of the glacier bed; such a rise would help stabilize the glacier. Without a rise in the bed, glacier thinning and retreat could result in continual grounding line retreat. The grounding line is where the bottom of the glacier comes in contact with the ground below the ice sheet, in this case the sea bottom. The grounding line is an anchoring point for the outlet glaciers. The length of the glacier that is grounded is both slowed and stabilized by resulting basal friction. Beyond the grounding line toward the margin, the floating ice shelf is susceptible to rapid calving retreat and as the grounding line retreats, so would the calving front. Note in the image below that the situation is even less stable than Hughes speculated. The current grounding line is at a higher elevation than the bed of the glacier for the next 200 km inland of this grounding line. (Note, inland is to the left in the figure, below.) The deeper the basin, the thicker the ice must be to maintain grounding. This makes it tough to slow grounding line retreat once it begins in a deepening basin.
Pine-Is-Glacier4
Basal topography profile of Pine Island Glacier (from Shepherd et al., 2001)
The weak underbelly idea was forgotten for some time. While I was attending a conference on rapid glacier flow in Vancouver BC in 1986, data were presented that showed no acceleration of Pine Island Glacier. This was further noted for the entire 1970’s to early 1990’s period by Lucchita and others (1995).

Then, in 1998, Rignot (1998) used satellite imagery to identify that the grounding line of Pine Island Glacier had retreated 5 km from 1992 to 1996. In the same year, Wingham and others (1998) observed a 10 cm per year thinning in the drainage basins for Thwaites and PIG during the 1990’s. Shepherd and others (2001) noted thinning in the fast flow areas of the glacier of 1.6 m/year between 1992 and 1999. This led them to conclude that the observed inland thinning and acceleration of PIG was a response to enhanced glacier bed lubrication. Not from surface melting of course as there is next to none on this glacier. Rignot and others (2002) noted that the glacier had accelerated 18% over a 150 km long section of the glacier in the fast flow area between 1992 and 2000. Change was afoot: after 50 years of apparent stability, the glacier calving front was retreating, and the grounding line was retreating indicating reduced bedrock anchoring. The reduction in basal friction would then lead to faster flow and more thinning. Was this just a short-term increase?

In 2006 and 2007, instruments were placed directly on PIG for the first time by the British Antarctic Survey. Four GPS receivers monitored ice flow from 55 to 171 km inland of the calving front at the center of the glacier (Scott and others, 2009). Glacier velocities had been noted at each site in 1996; by 2007 the respective increase in velocity was 42%, 36%, 34% and 26% respectively, an approximately 2 to 3% annual increase. The increase from 2006 to 2007 was 6.4% at 55 km from the terminus and 4.1% at 171 km inland. The extent of the fast flowing portion of PIG is seen in the figure below. A separate data set, radar based was used by Rignot (2008) to identify a 42% acceleration of PIG between 1996 and 2007 accompanied by most of its ice plain becoming ungrounded.

PIG_TG
Velocity map of Pine Island and Thwaites Glaciers. Rignot, 2008

Scott and others (2009) pointed out that the greater thinning toward the grounding line and terminus increased the surface slope and the gravitational driving stress, further promoting acceleration. Then Wingham and others (2009) reported that the 5400 km² central trunk of the glacier had experienced a quadrupling in the average rate of volume loss quadrupling from 2.6 km3 a year in 1995 to 10.1 km3 a year in 2006. PIG had an annual volume flux at the front of 28 km3 a year, so this increase is a marked change. Their observations were that the region of lightly grounded ice at the glacier terminus is extending upstream, and the changes inland are consistent with the effects of a prolonged disturbance to the ice flow, such as the effects of ocean-driven melting. Further examination of the bed topography by Vaughan and others (2006) indicates that most of the bed of the drainage basin of PIG is more than 500 meters below sea level, and there is a particularly deep basin in the eastern section of the upper basin. The observed acceleration, retreat of the grounding line, thinning of the lower section of the glacier, and the observed elevation of the basal topography provide no indication that this is not a weak underbelly of WAIS.

The evidence does indicate that one of the basic underlying principles, proposed by Mercer and Hughes, of what can stabilize or destabilize WAIS was right on the money. The evidence reviewed does not fully confirm the weak underbelly hypothesis, but it provides enough evidence that we had best monitor the situation and expand our attempts to understand it. That is just what the glaciological and scientific community are doing. A number of projects from the British Antarctic Survey, NASA and NSF will continue to expand the research in the area. In January 2008 Robert Bindschadler (NASA) landed on the floating ice shelf of PIG. They found the situation hazardous for plane landing but did leave behind several instruments. NSF has decided to fund establishment of a helicopter camp to safely study the ice-ocean interaction during the 2010-11 summer field season in Antarctica. In 2009 a team of British and American scientists deployed an autonomous robot submarine on six missions beneath the PIG ice shelf using sonar scanners to map the seabed and the ice shelf bottom. This fall NASA’s Operation Ice Bridge has focused much of its energy on the Pine Island Glacier. Seelye Martin of the University of Washington notes that “Pine Island Glacier is a major focus for our mission. We have four flights planned for this glacier. One of our hopes with these flights is to understand the detailed topography under the floating ice tongue. That topography controls the rate of melting there.”

PIGBasal
Basal topography of Pine Island Glacier region (from Vaughan et al, 2006).

Link to this Real Climate blog post:  http://www.realclimate.org/index.php/archives/2009/11/is-pine-island-glacier-the-weak-underbelly-of-the-west-antarctic-ice-sheet/