Showing posts with label Arctic melt season. Show all posts

Stronger positive feedbacks in the Arctic Sea: Larger heat transport to the Arctic, in particular in the Barents Sea, reduces the sea ice cover in this area

AGW Observer (a most excellent resource on what is being published on AGW), see also Kwok & Cunningham at the bottom on loss of multi-year Arctic Sea ice:

Published last week:

Ocean transporting heat to Arctic leads to more warming
A new study has looked at Arctic warming and sea ice. The study concentrated on the ocean heat transport. The results: “Those models which transport more energy to the Arctic show a stronger future warming, in the Arctic as well as globally. Larger heat transport to the Arctic, in particular in the Barents Sea, reduces the sea ice cover in this area. More radiation is then absorbed during summer months and is radiated back to the atmosphere in winter months. This process leads to an increase in the surface temperature and therefore to a stronger polar amplification. The models which show a larger global warming agree better with the observed sea ice extent in the Arctic. In general, these models also have a higher spatial resolution.” And conclusion: “These results suggest that higher resolution and greater complexity are beneficial in simulating the processes relevant in the Arctic, and that future warming in the high northern latitudes is likely to be near the upper range of model projections, consistant with recent evidence that many climate models underestimate Arctic sea ice decline.”
Citation: Irina Mahlstein and Reto Knutti, Ocean heat transport as a cause for model uncertainty in projected Arctic warming, Journal of Climate 2010, doi: 10.1175/2010JCLI3713.1. [abstract]
Positive low-cloud feedback from CERES and ECMWF data
Eitzen and others have studied how low-altitude cloud amount changes with sea surface temperature. Their data doesn’t cover very long period, only 5 years of data from CERES and from ECMWF reanalysis. The results: “First, the low cloud amount … and the logarithm of low cloud optical depth … tend to decrease while the net cloud radiative effect … becomes less negative as SST anomalies increase.” And: “The residual positive change in net cloud radiative effect … and small changes in low cloud amount … and decrease in the logarithm of optical depth … with SST are interpreted as a positive cloud feedback, with cloud optical depth feedback being the dominant contributor.” There are some differences regionally in the feedback amount: “with the largest positive feedbacks (~4 W m−2 K−1) in the southeast and northeast Atlantic regions and a slightly negative feedback (−0.2 W m−2 K−1) in the south-central Pacific region.”
Citation: Zachary A. Eitzen, Kuan-Man Xu, and Takmeng Wong, An Estimate of Low Cloud Feedbacks from Variations of Cloud Radiative and Physical Properties with Sea Surface Temperature on Interannual Time Scales, Journal of Climate 2010, doi: 10.1175/2010JCLI3670.1. [abstract]
Whales measuring ocean temperature
This article reports narwhals measuring ocean temperature: “Fourteen narwhals were instrumented with satellite-linked time-depth-temperature recorders between 2005 and 2007.” The whales took dives and temperatures were recorded. Results: “Whale data correlated well with climatological temperature maxima; however, they were on average 0.9°C warmer ±0.6°C (P < 0.001). Furthermore, climatology data overestimated the winter surface isothermal layer thickness by 50–80 m. Our results suggest the previously documented warming in Baffin Bay has continued through 2007 and is associated with a warmer West Greenland Current in both of its constituent water masses." But really the point of this article is: “This research demonstrates the feasibility of using narwhals as ocean observation platforms in inaccessible Arctic areas where dense sea ice prevents regular oceanographic measurements and where innate site fidelity, affinity for winter pack ice, and multiple daily dives to >1700 m offer a useful opportunity to sample the area.”
Citation: Laidre, K. L., M. P. Heide-Jørgensen, W. Ermold, and M. Steele (2010), Narwhals document continued warming of southern Baffin Bay, J. Geophys. Res., 115, C10049, doi:10.1029/2009JC005820. [abstract]
Sea level spectrum shows global sea level rising
A new study has taken the spectrum of sea level variations. In addition to that: “We present a method of plotting spectral information as color, focusing on periods between 2 and 24 weeks, which shows that significant spatial variations in the spectral shape exist and contain useful dynamical information.” With this method: “For global mean sea level, the statistical error reduces to 0.1 mm/yr over 12 years, with only 2 years needed to detect a 1 mm/yr trend. We find significant regional differences in trend from the global mean. The patterns of these regional differences are indicative of a sea level trend dominated by dynamical ocean processes over this period.”
Citation: Hughes, C. W., and S. D. P. Williams (2010), The color of sea level: Importance of spatial variations in spectral shape for assessing the significance of trends, J. Geophys. Res., 115, C10048, doi:10.1029/2010JC006102. [abstract]
Cryo-hydrologic warming making it easier for Greenland to melt
Cryo-hydrologic (CH) warming means that the melt-water in the surface of the ice-sheet warms the ice which then of course melts some more. A new study has used a thermal model of ice sheets including the CH-warming to research the situation. The CH-warming does wonders to the timescales of the ice-sheet melt: “The corresponding time-scale of thermal response is of the order of years-decades, in contrast to conventional estimates of thermal response time-scales based on vertical conduction through ice (∼10^2–3 m thick), which are of the order of centuries to millennia.” That doesn’t sound very promising. Is it occurring yet? Yep: “We show that CH warming is already occurring along the west coast of Greenland. Increased temperatures resulting from CH warming will reduce ice viscosity and thus contribute to faster ice flow.”
Citation: Phillips, T., H. Rajaram, and K. Steffen (2010), Cryo-hydrologic warming: A potential mechanism for rapid thermal response of ice sheets, Geophys. Res. Lett., 37, L20503, doi:10.1029/2010GL044397. [abstract]
Rapid climate change lessons from the past
Rapid climate changes have occurred in the past, as can be seen in the geological record. The journal Global and Planetary Change is publishing a special issue on the rapid climate changes. The introduction paper has now been published and the abstract says: “Rapid climate changes are known to have occurred over time periods equal to or even less than a human lifespan: moreover, their impacts on the global system are sufficiently large to have had significant societal impacts.” We currently seem to be facing a rapid climate change, so the knowledge of rapid climate changes in the past is important. The introductory paper gives an overview of the papers in the special issue. The overall conclusion is: “The results confirm the importance of freshwater forcing in triggering changes in Atlantic Meridional Overturning Circulation (MOC) and the close links between MOC and rapid climate change.”
Citation: Jonathan Holmes, John Lowe, Eric Wolff, and Meric Srokosz, Rapid climate change: Lessons from the recent geological past, Global and Planetary Change, doi:10.1016/j.gloplacha.2010.10.005. [abstract]
Northern Annular Mode causes uncertainties to future northern climate
The Northern Annular Mode (NAM) is a variability in the atmosphere that has an effect to climate in Northern Hemisphere. NAM is expected to change with increasing greenhouse effect. The changes in NAM are not known very well, the climate models give different kinds of responses to greenhouse forcing. A new study has looked how much uncertainty NAM introduces to northern regional climate. That was estimated from the spread of different model results. The result: “We show that the intermodel spread of the future NAM projections account for up to 40% of the variance of the surface temperature and precipitation projections over some regions in Eurasia and North America across the simulations. This result implies that the uncertainty in the future NAM makes a considerable contribution into the overall uncertainty in regional climate predictions.”
Citation: Karpechko, A. Yu. (2010), Uncertainties in future climate attributable to uncertainties in future Northern Annular Mode trend, Geophys. Res. Lett., 37, L20702, doi:10.1029/2010GL044717. [abstract]
Pine Island Glacier contribution to sea level less than 3 cm
Pine Island Glacier (PIG) in Antarctica might contribute considerably to the global sea level rise as PIG is losing mass rapidly. A new study has created a model for studying that contribution. The reasons for mass loss are discussed: “While oceanic melt likely played the leading role in recent thinning and retreat, we find that the particular grounding-line geometry with an extended ice plain in the 1990s made it susceptible to such forcing. Our model further indicates that while the rate of grounding-line retreat should diminish soon, the glacier’s mass loss may continue at rates similar to, or moderately elevated from, the present.” Then on the rate of mass loss: “While substantial, our model-derived maximum rate of 2.7 cm/century is considerably smaller than previous heuristically-derived bounds on the sea-level contribution.”
Citation: Joughin, I., B. E. Smith, and D. M. Holland (2010), Sensitivity of 21st century sea level to ocean-induced thinning of Pine Island Glacier, Antarctica, Geophys. Res. Lett., 37, L20502, doi:10.1029/2010GL044819. [abstract]
Measuring the heat flux to the oceans
The net air–sea surface heat flux has been measured in North Pacific and North Atlantic between 1984 and 2004. It turns out that the net heat flux is going into the oceans in most of the measured areas. Both in the areas of heat flux going into the oceans and in the areas of heat flux going into the atmosphere the underlying causes can be traced to the global warming.
Citation: Gen Li, Baohua Ren, Jianqiu Zheng and Chengyun Yang, Net air–sea surface heat flux during 1984–2004 over the North Pacific and North Atlantic oceans (10°N–50°N): annual mean climatology and trend, 2010, Theoretical and Applied Climatology, DOI: 10.1007/s00704-010-0351-2. [abstract]
Biodiversity suffers in Europe with climate change
A new study has used environmental and climate models to estimate stable area of species and species turnover. Climate change will have remarkable effects: “We show that if global temperature increases, then both species turnover will increase, and mean stable area of species will decrease in all biomes. The most dramatic changes will occur in Northern Europe, where more than 35% of the species composition in 2100 will be new for that region, and in Southern Europe, where up to 25% of the species now present will have disappeared under the climatic circumstances forecasted for 2100.”
Citation: Rob Alkemade, Michel Bakkenes and Bas Eickhout, Towards a general relationship between climate change and biodiversity: an example for plant species in Europe, Regional Environmental Change, DOI: 10.1007/s10113-010-0161-1. [abstract]
Review article on global drought situation
Apparently there are some original research in this work as well. I don’t need to say much about this as there is a press release on this from UCAR.
Citation: Aiguo Dai, Drought under global warming: a review, Wiley Interdisciplinary Reviews: Climate Change, 2010, DOI: 10.1002/wcc.81. [abstract, full text]
Multiyear ice melting rapidly in the Beaufort Sea
New study by Kwok & Cunningham has made estimates on the multiyear ice trends in Beaufort Sea: “For the summers of 1993 through 2009, we estimate the loss of multiyear sea ice (MYI) area in the Beaufort Sea due to melt.” The loss of area was: “Net loss of area (with fractional MYI coverage >50%) over the 17-year period is ∼900 × 103 km2. Three-quarters of that area, ∼10% of the area of the Arctic Ocean, was lost after 2000.” (The “∼” is most likely a “~”.) Rest of the abstract is worth quoting as well: “There is a clear positive trend in the record, with a distinct peak of 213 × 103 km2 in 2008; this is twice the summer outflow at the Fram Strait that year. The net melt area of 490 × 103 km2 between 2005 and 2008 accounts for nearly 32% of the net loss of 1.54 × 10⁶ km2 of Arctic Ocean MYI coverage over the same period. Volume loss, for the years with ICESat thickness (2004–2009), is highest at 473 km3 in 2008 followed by 320 km3 in 2007. Net loss in MYI volume for the six summers is ∼1400 km3. This is ∼20% of the loss in MYI volume of 6300 km3 during 2004–2008. This adds to the freshwater content of the Arctic Ocean and locally to the freshening of the Beaufort Gyre.”
Citation: Kwok, R., and G. F. Cunningham (2010), Contribution of melt in the Beaufort Sea to the decline in Arctic multiyear sea ice coverage: 1993–2009, Geophys. Res. Lett., 37, L20501, doi:10.1029/2010GL044678. [abstract]
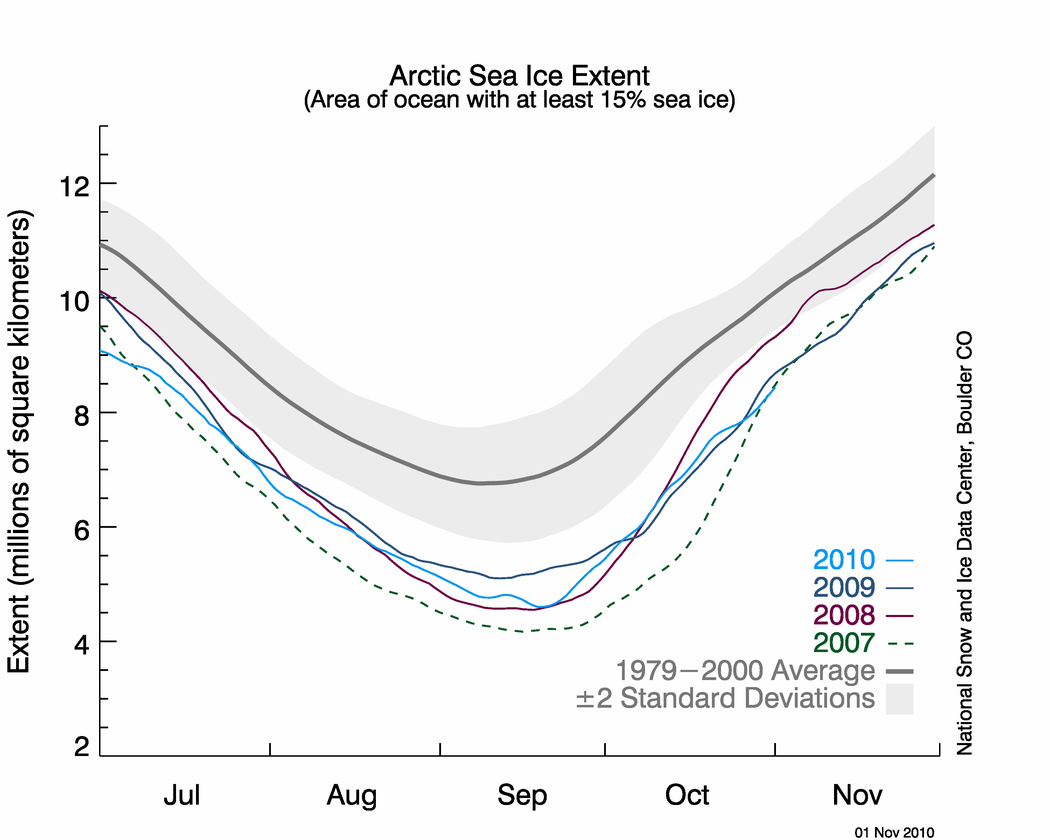
Arctic Sea Ice hits a record low for this time of year

Arctic Sea Ice hits a record low for this time of year


Figure 2. The graph above shows daily Arctic sea ice extent as of November 1, 2010, along with daily ice extents for years with the previous four lowest minimum extents. Light blue indicates 2010, dark blue shows 2009, purple shows 2008, dotted green indicates 2007, and dark gray shows the 1979 to 2000 average. The gray area around the average line shows the two standard deviation range of the data. Sea Ice Index data. —Credit: National Snow and Ice Data Center

Conditions in context:

Following the minimum ice extent on September 19, 2010, the ice cover quickly expanded as polar darkness returned to the Arctic and air temperatures dropped. Ice grew at an average daily rate for the month of October of 92,700 kilometers per day (35,800 square miles per day). This was similar to the growth rate in 2009, but slower than the growth rate following the 2007 and 2008 minimum ice extents. It was slightly faster than the 1979 to 2000 average rate of 82,200 square kilometers (31,700 square miles) per day.

At the end of October, ice growth slowed, and at the end of the month extensive open water areas remained in the Beaufort, Chukchi, Kara and Barents Seas. This region had the warmest ocean surface temperatures at the end of the melt season.

Link:  http://nsidc.org/arcticseaicenews/

Arctic Sea ice extent not ready to call its melting quits yet -- looks like we have a double dip

Dear Readers,


It is little discussed, but in general the planetary water vapor streams eventually carry the energy from hurricanes and typhoons up to the Arctic Sea. Typhoon energy goes up through the Bering Strait. Naturally, if they make landfall, a lot of energy is dissipated, but if they do not make landfall, then it usually ends up in the far North.


This year, China was hit with 10 typhoons already, and I don’t know how many did not reach land but were just sucked up to the Arctic Sea, instead, much like in 2007.


Looks like another one is set to hit China:


http://cimss.ssec.wisc.edu/ tropic/ real-time/ mosaic/ movies/ moswwvbbm/ moswwvbbmjava.html


Since I tend to watch the Univ. Wisc. WV satellite animations nearly every day, and could see this occurring, especially over the past few weeks, I am not at all surprised that there was a double dip.


This link shows the entry to the Bering Strait better, but nothing of note is occurring today — if you look at it regularly like I do, then you begin to get a sense of how the energy is transported. 


http://weather.unisys.com/satellite/sat_wv_hem_loop-12.html


If the energy were not continuously transported away from the Equator and toward the poles, the temperature at the Equator would be much higher and that of the poles much lower. 


However, what is really more important is the sea ice volume, not the extent.  The Polar Ice Center's graph of Arctic ice volume shows that this summer there was a precipitous decline (well out of the 2 SD lower limit) and then some recovery -- we need to watch that graph to see if there is going to be a further dip in volume this year (please click on the graph to enlarge it):


I'm gonna add some comments here since blogspot is telling me my comment is too long!


This one is for ljgeoff:

Loss of Summer Sea Ice -- Impacts

First, an interesting look through the eyes of the native Inuits is provided in Dr. Heidi Cullen's recent book, "The Weather of the Future."

If you do not have access to the book, there really is a huge list of impacts, and lots of research on all of them.

Here on this blog, for example, there are tons of articles on melting permafrost.  If you look at a map of northern Siberia, you can see that it was once an enormous flood plain or marsh running up to the edge of the Arctic Sea, which is not all that deep there.

That land and sea will warm rapidly when there is no ice cover, releasing untold quantities of methane.

Cullen points out that when there is ice cover, the air is much cold and drier.  Further, the warmth in the water below the sea ice is not transferred to the air.  We know that the water's temperature is increasing.  Take away the ice cover and the energy gets transferred from the water to the air pretty quickly.

The Inuit say that the ice does not form now like it used to because of clouds.  It's one of those positive feedbacks (remember: a positive feedback means more warming).

We can also expect the winds passing over this open water that reach Greenland to cause the Greenland Ice Sheet to melt faster because they will be warmer and wetter than if they had passed over sea ice.

I am not exactly sure, but the changes in the monsoon over the U.S. Southwest may not be as affected by the lack of sea ice in the Arctic as it is by the huge amount of heat pumping out of the Pacific Ocean at the Equator.

The thing that I think no one really knows is just what exactly the new weather patterns will be over the Arctic once the sea ice is gone and it is quite warm up there. Well, actually, I think the modelers have done the model runs but they just don't want to tell us yet.  But let me put it this way (very simply) -- there used to be this cap of cold air that hung around the North Pole, and the hot air from the south has been pushing that cold air out of the Arctic, and just weakening it, and reducing it.  Eventually, there won't be a lot of it left.  What is that going to do to weather patterns in the Northern Hemisphere? I'd venture to say that they won't be anything like what we have been used to for hundreds of years.  How on earth a farmer will be able to tell when to plant crops is beyond me.

Tenney


by Joseph Romm, Climate Progress, September 18, 2010

So the fat lady sang, but I guess she hit just the right note and  shattered some more ice.  Or it could be those pesky greenhouse gases, which  always seem to be causing trouble…


http://www.ijis.iarc.uaf.edu/seaice/extent/AMSRE_Sea_Ice_Extent_L.png

That plot is from the Japan Aerospace Exploration Agency (click to enlarge), whose latest value for sea ice extent (yesterday) is 4,832,813 km2.  There  appears to be a real chance JAXA’s extent will drop below the 2008 level.

Their data for the last ten days shows how sharp this new downturn is:


09,07,2010:  5027188
09,08,2010:  4989375
09,09,2010:  4972656
09,10,2010:  4952813
09,11,2010:  4986406
09,12,2010:  5005000
09,13,2010:  5008750
09,14,2010:  4998594
09,15,2010:  4948438
09,16,2010:  4890938
09,17,2010:  4832813

You may have  noticed that  the National Snow and Ice Data Center, which called a minimum a few days ago,  doesn’t show a full double dip (yet):
http://nsidc.org/data/seaice_index/images/daily_images/N_stddev_timeseries.png

That’s in part because they use a different metric.  As JAXA explains:
In general, sea-ice extent is defined as a temporal average of several days (e.g., five days) in order to eliminate calculation errors due to a lack of data (e.g., for traditional microwave sensors such as SMMR and SSM/I). However, we adopt the average of two days to achieve rapid data release. The wider spatial coverage of AMSR-E enables reducing the data-production period.
NSIDC uses the less volatile five-day average, which  bottomed out, for them, on  September 10 at 04.72 h.  As of  yesterday, they  tell me they haven’t  passed that — yet.

The sea ice area  picture seems a little muddier:

http://www.ijis.iarc.uaf.edu/seaice/extent/AMSRE_Sea_Ice_Area.png

I can’t find  the actual data for this plot.  If  anyone knows where it is, please post the link.

NSIDC told me that as of Wednesday, it’s “only in the E. Siberian Sea where you’ve had consistent ice growth over the last few days, whereas the other seas still show decreases, or oscillate between increases and decreases.”

So it seems possible to me that volume never went back up and could possibly have continued declining, as the  thicker ice continued to be melted from underneath.  But  there is no real way of knowing at this point.
Stay tuned!

Link:  http://climateprogress.org/2010/09/18/arctic-sea-ice-melt-aint-over-til-its-over/#comment-296855

Sharp drop in oldest, thickest Arctic sea ice. 2010 melt season ends, likely setting the record for lowest volume

2010 melt season ends, likely setting the record for lowest volume

by Joseph Romm, Climate Progress, September 14, 2010
 
Last week, National Snow and Ice Data Center (NSIDC) director Mark Serreze said, “Every bit of evidence we have says the ice is thinning.”  Monday, NSIDC scientist Julienne Stroeve sent me this figure from a forthcoming article using data provided by J. Maslanik and C. Fowler (click to enlarge):

wintericeage Small
This is the end-of-winter sea ice extent in the Arctic Basin, broken down by age.  Stroeve explains:

This figure would support thinning of the icepack over the last couple of decades since older ice tends to be thicker than younger ice.  You can see in this figure how little of the really old, and thick ice there is left in the Arctic Basin.
In fact, the figure shows ice 5 years or older dropping from 800,000 sq-km in 2008 to 400,000 in 2009 to only 320,000 sq-km.

Spring 2010 also saw a record low in the amount of ice 4 years or older.

Now you can see that we just about hit the same Arctic sea ice area that we did in 2008:

http://www.ijis.iarc.uaf.edu/seaice/extent/AMSRE_Sea_Ice_Area.png

Given that the ice is almost certainly thinner now than in 2008, we are very likely to have witnessed a lower total ice volume.

Remember, 2008 had substantially less ice volume than 2007, even though it had more area.  Last year, some of the leading cryoscientists at JPL, the Polar Science Center at the University of Washington, and NASA published a major peer-reviewed article, “Thinning and volume loss of the Arctic Ocean sea ice cover: 2003–2008” (subs. req’d).

You can find a basic discussion of their findings here on NASA’s website, which points out, “Arctic sea ice thinned dramatically between the winters of 2004 and 2008, with thin seasonal ice replacing thick older ice as the dominant type for the first time on record.”  That link has some excellent figures, like this one:

Arctic Ice Volume

Today, PSC’s Pan-Arctic Ice Ocean Modeling and Assimilation System (PIOMAS) has determined that “September Ice Volume was lowest in 2009 at 5,800 km³ or 67% below its 1979 maximum” and that “Total Arctic Ice Volume for March 2010 is 20,300 km³, the lowest over the 1979-2010 period.”

So although it may be a while before we have a definitive statement, the likelihood seems high that we just set the record low Arctic sea ice volume — possibly for several thousand years (see Major analysis finds “less ice covers the Arctic today than at any time in recent geologic history”).

Link:  http://climateprogress.org/2010/09/14/exclusive-scientists-track-sharp-drop-in-oldest-thickest-arctic-sea-ice/#more-33196

Serreze: Arctic is “continuing down in a death spiral. Every bit of evidence we have says the ice is thinning.”

Climate Progress, September 9, 2010

UPDATE:  National Snow and Ice Data Center (NSIDC) director Mark Serreze slammed the anti-science disinformers yesterday:
There are claims coming from some communities that the Arctic sea ice is recovering, is getting thicker again. That’s simply not the case.  It’s continuing down in a death spiral.

Every bit of evidence we have says the ice is thinning.  That means there’s less energy needed to melt it out than there used to be.
Certainly the latest analysis from the  Polar Science Center bears that out:


Volume NS

Arctic sea ice volume, extent, and area continue to shrink apace as we approach the dramatic end to this year’s melt season.  The NSIDC tells me extent dropped to 4.76 million square kilometers today — which is below the majority of even the most recent expert predictions logged with the Study of Environmental Arctic Change (SEARCH).
Here’s one of the sea ice graphs on the web I haven’t posted before, from the University of Bremen (click to enlarge), one of the resources that SEARCH recommends:

http://www.iup.uni-bremen.de:8084/amsr/ice_ext_n.png

An unexpected source suggested I ask NSIDC scientist Julienne Stroeve to explain what is going on.  I did, and she replied:
We’ve dropped to 4.76 today.
All the old ice that was transported into the Chukchi Sea over the winter is gone and about 50% of the old ice in the Beaufort Sea remains.
Arctic-wide there has been a 60% reduction in ice ages 5+ years from the end of April to the end of August.  Atmospheric circulation patterns in summer 2010 were not as favorable to ice loss as in 2007 and 2008, so this suggests that the ice may have been on the thin side.
I haven’t looked into detail on the SSTs, and there is compression towards the  pole in the Chukchi that is contributing, but given the continued ice loss this month, which is double that of climatology, and faster than in 2007 and 2009 (but a bit slower than 2008), I’m thinking it’s a combination of warmer SSTs and thin ice that is continuing the current ice loss.
The water is warm — see Captain’s log from the Chukchi Sea: “The water temperature is 7.5 degrees. If we weren’t sailing, it would be a great temperature for a swim!”; “North of Point Hope. Water temperature: 9.0 ˚C.”

Sometimes it is the wind that helps push the ice together and drive down sea ice extent.  This year’s rapid end-of-season extent drop is partly due to some compression, but appears to be driven more by warmer waters  and thinner ice, which is not a big surprise — see Study: “It is clear … that the precipitous decline in September sea ice extent in recent years is mainly due to the cumulative loss of multiyear ice.”

Human emissions of greenhouse gases are warming the planet and polar amplification is accelerating that process in the Arctic.

Featured comment (from Steve Bloom):   Joe, I’ll suggest again posting this animation (by Jack Taylor via Neven’s Arctic sea ice blog) of UniBremen ice concentrations from 8/26 through 9/8. It demonstrates perfectly the thin and mobile ice conditions plus the effect of the dipole anomaly.

Related posts:
Link:  http://climateprogress.org/2010/09/09/julienne-stroeve-nsidc-scientist-arctic-sea-ice-melt/

Arctic melt season growing longer by 6.4 days per decade, between 1979 and 2007

Melt Season in the Arctic Getting Longer

NASA's Earth Observatory, January 29, 2010
Melt Season in the Arctic Getting Longer
   
Melt Season in the Arctic Getting Longer
  acquired 1979-2007
 
 
The icy cap over Earth’s North Pole reaches its summer minimum in September and its winter maximum in late February or early March. Satellite observations since 1979 have shown that amount of ice that survives the summer is getting smaller; declines have been especially dramatic in the past decade. Recently, scientists from NASA and the National Snow and Ice Data Center described another way Arctic sea ice is changing: the summer melt season is getting significantly longer.

This trio of images shows changes between 1979 and 2007 in the average date of melt onset in the spring (left), the first autumn freeze (center), and the total average increase in the length of the Arctic sea ice melt season. The color scales show the trends in days per decade. Red indicates trends consistent with warming: earlier melt onset, later freezes, and longer total melt season. White indicates little or no change. The maps are based on satellite observations of microwave energy radiated from the ice. (Even a small amount of melt water on snow or ice dramatically changes the way the surface looks in the microwave part of the electromagnetic spectrum.)

These maps represent changes in what the scientists describe as the “continuous melt season.” It is usual for the first melt events of the spring season to be interrupted by a return to freezing conditions. But eventually a day arrives when melting is continuous for the remainder of the summer: this is the day of melt onset. The season of continuous melt ends with the first freeze event of the fall.

According to this analysis, the average length of the continuous melt season in the Arctic increased by 6.4 days per decade between 1979 and 2007. In some places, however, the trends were far larger than the average, espcially around the lower-latitude edges of the ice pack. The graph below the figures illustrates how the length of the melt season varies significantly from year to year, but the long-term trend is clear.

The maps also show that, in most areas, the date of freeze onset is changing more than the date of melt onset. The scientists say this pattern is consistent with a climate process known as the ice-albedo feedback. Dark ocean water absorbs more sunlight than bright, reflective ice. Even a small change in the start of the melt season exposes the ocean to more incoming sunlight, which warms the water, which melts more ice, and so on. The more solar energy the ocean absorbs during the summer, the longer it takes in the fall for the water to cool down enough to freeze.

NASA Earth Observatory image by Robert Simmon, based on data from Jeffrey Miller and Thorsten Markus, NASA GSFC. Instrument: DMSP - SSM/I

NASA (T. Markus et al.): Arctic 'Melt Season' Is Growing Longer, New Research Demonstrates

Arctic 'Melt Season' Is Growing Longer, New Research Demonstrates

by Kathryn Hansen, Goddard Space Flight Center, January 27, 2010

New NASA-led research shows that the melt season for Arctic sea ice has lengthened by an average of 20 days over the span of 28 years, or 6.4 days per decade. The finding stems from scientists' work to compile the first comprehensive record of melt onset and freeze-up dates -- the "melt season" -- for the entire Arctic.
Arctic melt imageLarger image
Arctic sea ice has been facing longer melt seasons, according to a new study. Credit: NASA/Thorsten Markus

The melt season begins each April when the sunless winter gives way to sunrise and spring, and water and air temperatures rise. By September, the sea ice shrinks to a minimum and begins refreezing, bringing the annual melt season to an end.

The longer melt season, described by Thorsten Markus of NASA's Goddard Space Flight Center in Greenbelt, Md., in the Journal of Geophysical Research -- Oceans, has implications for the future of Arctic sea ice. Open water that appears earlier in the season absorbs more heat from the sun throughout summer, further warming the water and promoting more melting.

"This feedback process has always been present, yet with more extensive open water this feedback becomes even stronger and further boosts ice loss," Markus said. "Melt is starting earlier, but the trend towards a later freeze-up is even stronger because of this feedback effect."
Researchers analyzed satellite data for 10 different Arctic regions and found trends in melt and freeze onset days as well as trends in melt season length. Larger image
Researchers analyzed satellite data for 10 different Arctic regions and found trends in melt and freeze onset days as well as trends in melt season length. Credit: NASA/Thorsten Markus 

To examine melt season length, Markus and colleagues used data from satellite passive microwave sensors, which can "see" indications of melt. The result is an accurate account of the melt seasons from 1979 to 2007.

"Given that the Arctic ocean is nearly twice the size of the continental United States, it would be impossible to track change like this without long-term satellite records," said Thomas Wagner, NASA's cryosphere program scientist at NASA Headquarters, Washington.

Analyzing melt-season trends for 10 different Arctic regions, the research team discovered that melt season lengthened the most -- more than 10 days per decade -- in Hudson Bay, the East Greenland Sea, the Laptev and East Siberian Seas, and the Chukchi and Beaufort Seas. Some of that change is due to melt onset occurring about three days earlier per decade in some areas. Earlier melt means more heat can be absorbed by the open water, promoting more melting and later freeze-up dates -- more than eight days per decade later in some areas. Only the Sea of Okhotsk turned up a shorter melt season. The reasons for the regional differences are currently being investigated.

"The onset of melting and melt season length are important variables for understanding the Arctic climate system," Markus added. "Given the recent large losses of the Arctic summer ice cover, it has become critical to investigate the causes of the decline and the consequences of its continued decline."

The lengthened melt season could impact more than just the Arctic ice and ocean. According to Markus, "marine ecosystems are very sensitive to changes in melt onset and freeze-up dates."

Between 1979 and 2007, Arctic sea ice has begun melting an average of 2.8 days per decade earlier in the spring, and has begun refreezing an average of 3.7 days per decade later in the autumn.Larger image

Between 1979 and 2007, Arctic sea ice has begun melting (left map) an average of 2.8 days per decade earlier in the spring, and has begun re-freezing (center map) an average of 3.7 days per decade later in the autumn. Altogether, the length of the Arctic melt season (right map) has increased by about 20 days over the past 30 years. These maps are based on satellite observations of microwave energy radiated from the surface of sea ice. Credit: NASA images by Robert Simmon, based on data from Jeffrey Miller and Thorsten Markus.

"Changes in the Arctic sea ice cover may have profound effects on North America’s climate," said Wagner.

"Studies like this one show us how ice responds to variations in the ocean and atmosphere and improve the predictive models that will help us plan for climate change."

Link:  http://www.nasa.gov/topics/earth/features/longer-melt-season.html