Showing posts with label Arctic Ocean dipole anomaly. Show all posts

Sharp drop in oldest, thickest Arctic sea ice. 2010 melt season ends, likely setting the record for lowest volume

2010 melt season ends, likely setting the record for lowest volume

by Joseph Romm, Climate Progress, September 14, 2010
 
Last week, National Snow and Ice Data Center (NSIDC) director Mark Serreze said, “Every bit of evidence we have says the ice is thinning.”  Monday, NSIDC scientist Julienne Stroeve sent me this figure from a forthcoming article using data provided by J. Maslanik and C. Fowler (click to enlarge):

wintericeage Small
This is the end-of-winter sea ice extent in the Arctic Basin, broken down by age.  Stroeve explains:

This figure would support thinning of the icepack over the last couple of decades since older ice tends to be thicker than younger ice.  You can see in this figure how little of the really old, and thick ice there is left in the Arctic Basin.
In fact, the figure shows ice 5 years or older dropping from 800,000 sq-km in 2008 to 400,000 in 2009 to only 320,000 sq-km.

Spring 2010 also saw a record low in the amount of ice 4 years or older.

Now you can see that we just about hit the same Arctic sea ice area that we did in 2008:

http://www.ijis.iarc.uaf.edu/seaice/extent/AMSRE_Sea_Ice_Area.png

Given that the ice is almost certainly thinner now than in 2008, we are very likely to have witnessed a lower total ice volume.

Remember, 2008 had substantially less ice volume than 2007, even though it had more area.  Last year, some of the leading cryoscientists at JPL, the Polar Science Center at the University of Washington, and NASA published a major peer-reviewed article, “Thinning and volume loss of the Arctic Ocean sea ice cover: 2003–2008” (subs. req’d).

You can find a basic discussion of their findings here on NASA’s website, which points out, “Arctic sea ice thinned dramatically between the winters of 2004 and 2008, with thin seasonal ice replacing thick older ice as the dominant type for the first time on record.”  That link has some excellent figures, like this one:

Arctic Ice Volume

Today, PSC’s Pan-Arctic Ice Ocean Modeling and Assimilation System (PIOMAS) has determined that “September Ice Volume was lowest in 2009 at 5,800 km³ or 67% below its 1979 maximum” and that “Total Arctic Ice Volume for March 2010 is 20,300 km³, the lowest over the 1979-2010 period.”

So although it may be a while before we have a definitive statement, the likelihood seems high that we just set the record low Arctic sea ice volume — possibly for several thousand years (see Major analysis finds “less ice covers the Arctic today than at any time in recent geologic history”).

Link:  http://climateprogress.org/2010/09/14/exclusive-scientists-track-sharp-drop-in-oldest-thickest-arctic-sea-ice/#more-33196

Extraordinary September Arctic sea ice reductions and their relationships with storm behavior over 1979–2008

Geophysical Research Letters, 36 (2009) L19715; doi: 10.1029/2009GL039810.

Extraordinary September Arctic sea ice reductions and their relationships with storm behavior over 1979–2008

Ian Simmonds and Kevin Keay (School of Earth Sciences, The University of Melbourne, Victoria, Australia)

Received 29 June 2009; accepted 1 September 2009; published 14 October 2009

Abstract

Dramatic changes have been observed in Arctic sea ice, cyclone behavior and atmospheric circulation in recent decades. Decreases in September ice extent have been remarkable over the last 30 years, and particularly so in very recent times. The analysis reveals that the trends and variability in September ice coverage and mean cyclone characteristics are related, and that the strength (rather than the number) of cyclones in the Arctic basin is playing a central role in the changes observed in that region, especially in the last few years. The findings reinforce suggestions that the decline in the extent and thickness of Arctic ice has started to render it particularly vulnerable to future anomalous cyclonic activity and atmospheric forcing.

NSIDC Report of August 18, 2009: A change in ice motion slows seasonal decline

NSIDC Report of August 18, 2009: A change in ice motion slows seasonal decline

During the first half of August 2009, Arctic ice extent declined more slowly than during the same period in 2007 and 2008. The slower decline is primarily due to a recent atmospheric circulation pattern, which transported ice toward the Siberian coast and discouraged export of ice out of the Arctic Ocean. It is now unlikely that 2009 will see a record low extent, but the minimum summer ice extent will still be much lower than the 1979 to 2000 average.

Note: This mid-monthly analysis update shows a single-day extent value for Figure 1, rather than the usual monthly average. While monthly average extent images are more accurate in understanding long-term changes, the daily images are helpful in monitoring sea ice conditions in near-real time.

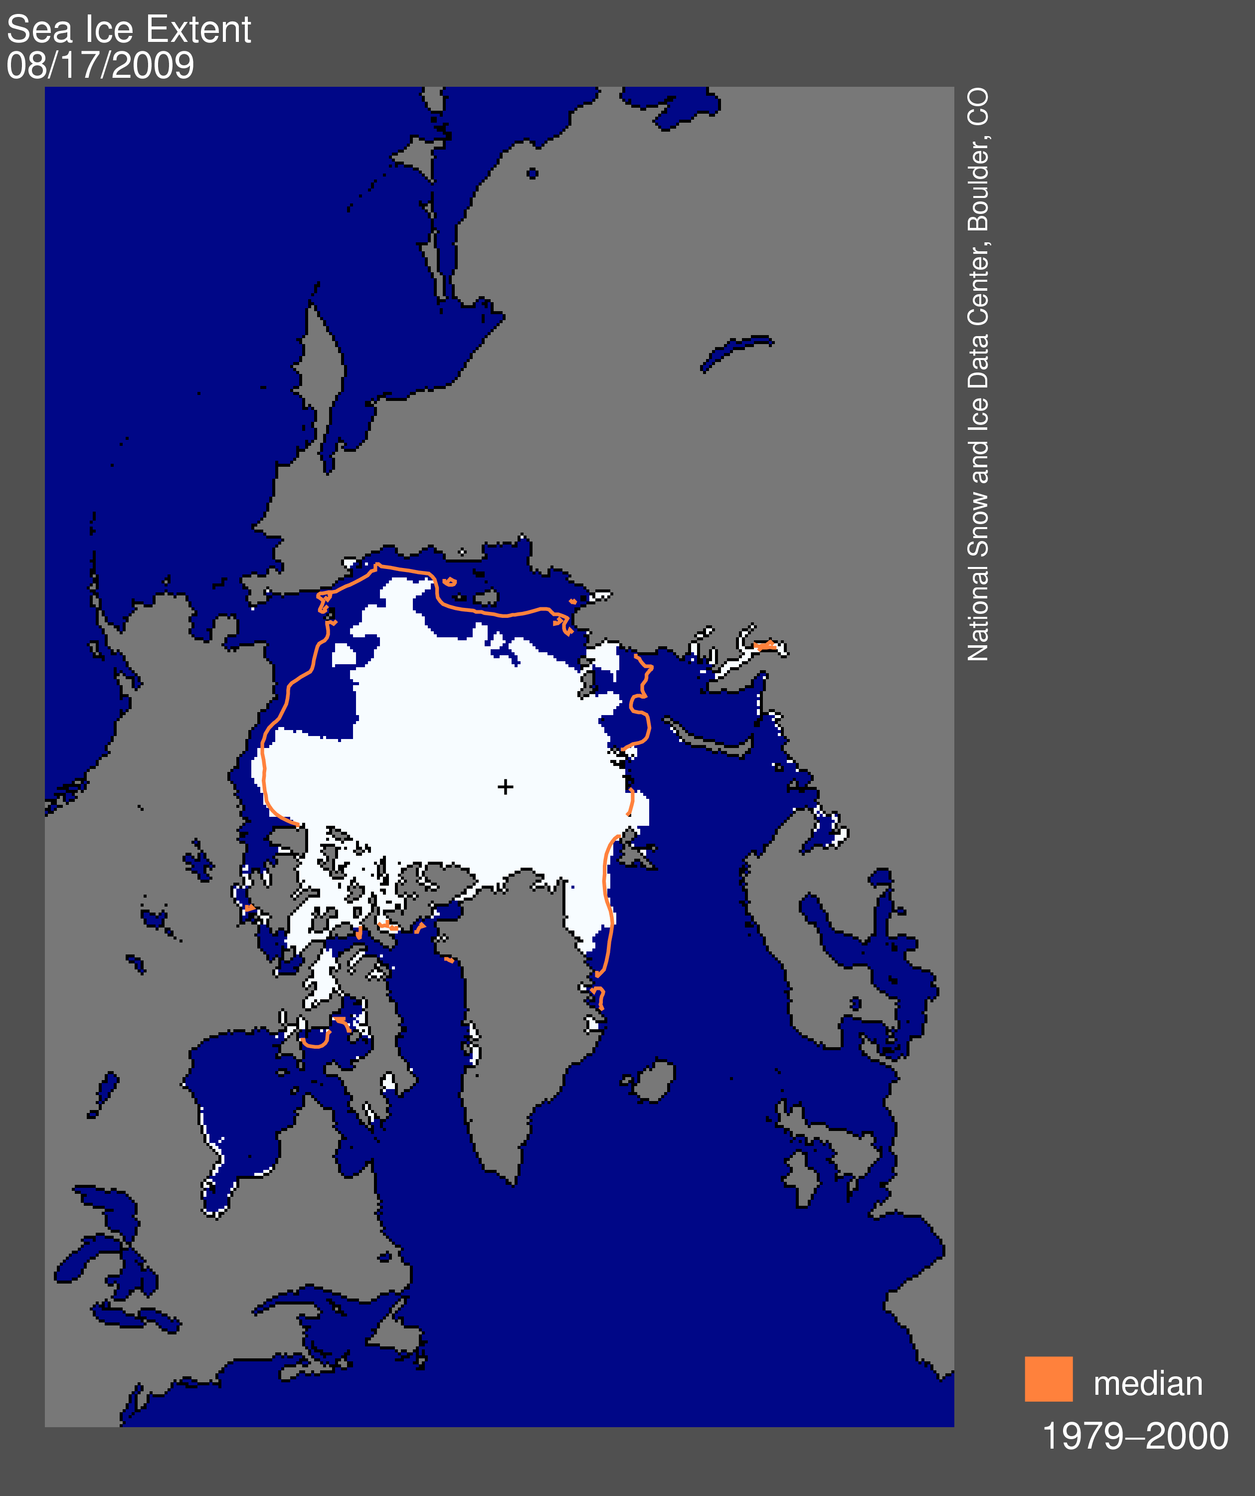
map from space showing sea ice extent, continentsFigure 1. Daily Arctic sea ice extent on August 17, 2009, was 6.26 million km² (2.42 million sq. miles). The orange line shows the 1979-2000 median extent for that day. The black cross indicates the geographic North Pole. Sea Ice Index data. About the data. —Credit: National Snow and Ice Data Center. High-resolution image

Overview of conditions

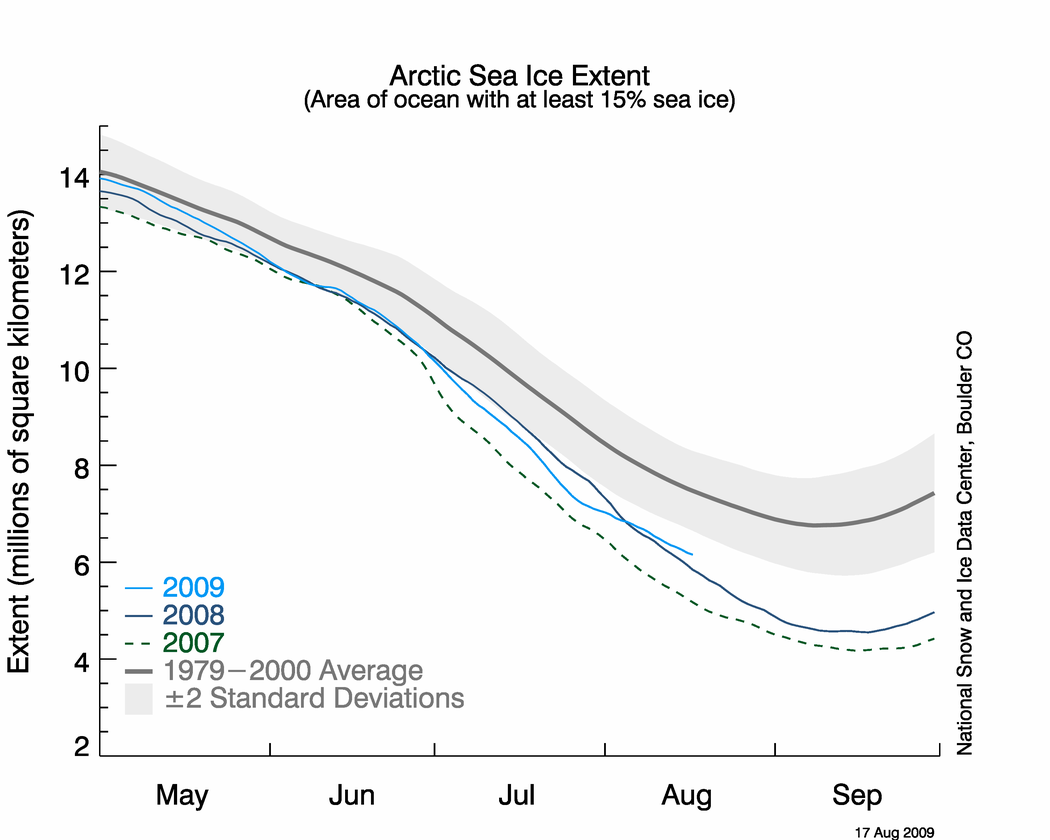
On August 17, 2009, Arctic sea ice extent was 6.26 million km² (2.42 million sq. miles). This is 960,000 km² (370,000 sq. miles) more ice than for the same day in 2007, and 1.37 million km² (530,000 sq. miles) below the 1979-2000 average. On August 8, the 2009 extent decreased below the 1979-2000 average minimum annual extent, with a month of melt still remaining.

graph with months on x axis and extent on y axis Figure 2. The graph above shows daily sea ice extent as of August 17, 2009. The solid light blue line indicates 2009; the solid dark blue line shows 2008; the dashed green line shows 2007; and the solid gray line indicates average extent from 1979 to 2000. The gray area around the average line shows the two standard deviation range of the data. Sea Ice Index data. —Credit: National Snow and Ice Data Center. High-resolution image

Conditions in context

From August 1 to 17, Arctic sea ice extent declined at an average rate of 54,000 km² (21,000 sq. miles) per day. This decline was slower than the same period in 2008, when it was 91,000 km² (35,000 sq. miles) per day, and for the same period in 2007, when ice extent declined at a rate of 84,000 km² (32,000 sq. miles) per day. The recent rate of ice loss has slowed considerably compared to most of July. Arctic sea ice extent is now greater than the same day in 2008.

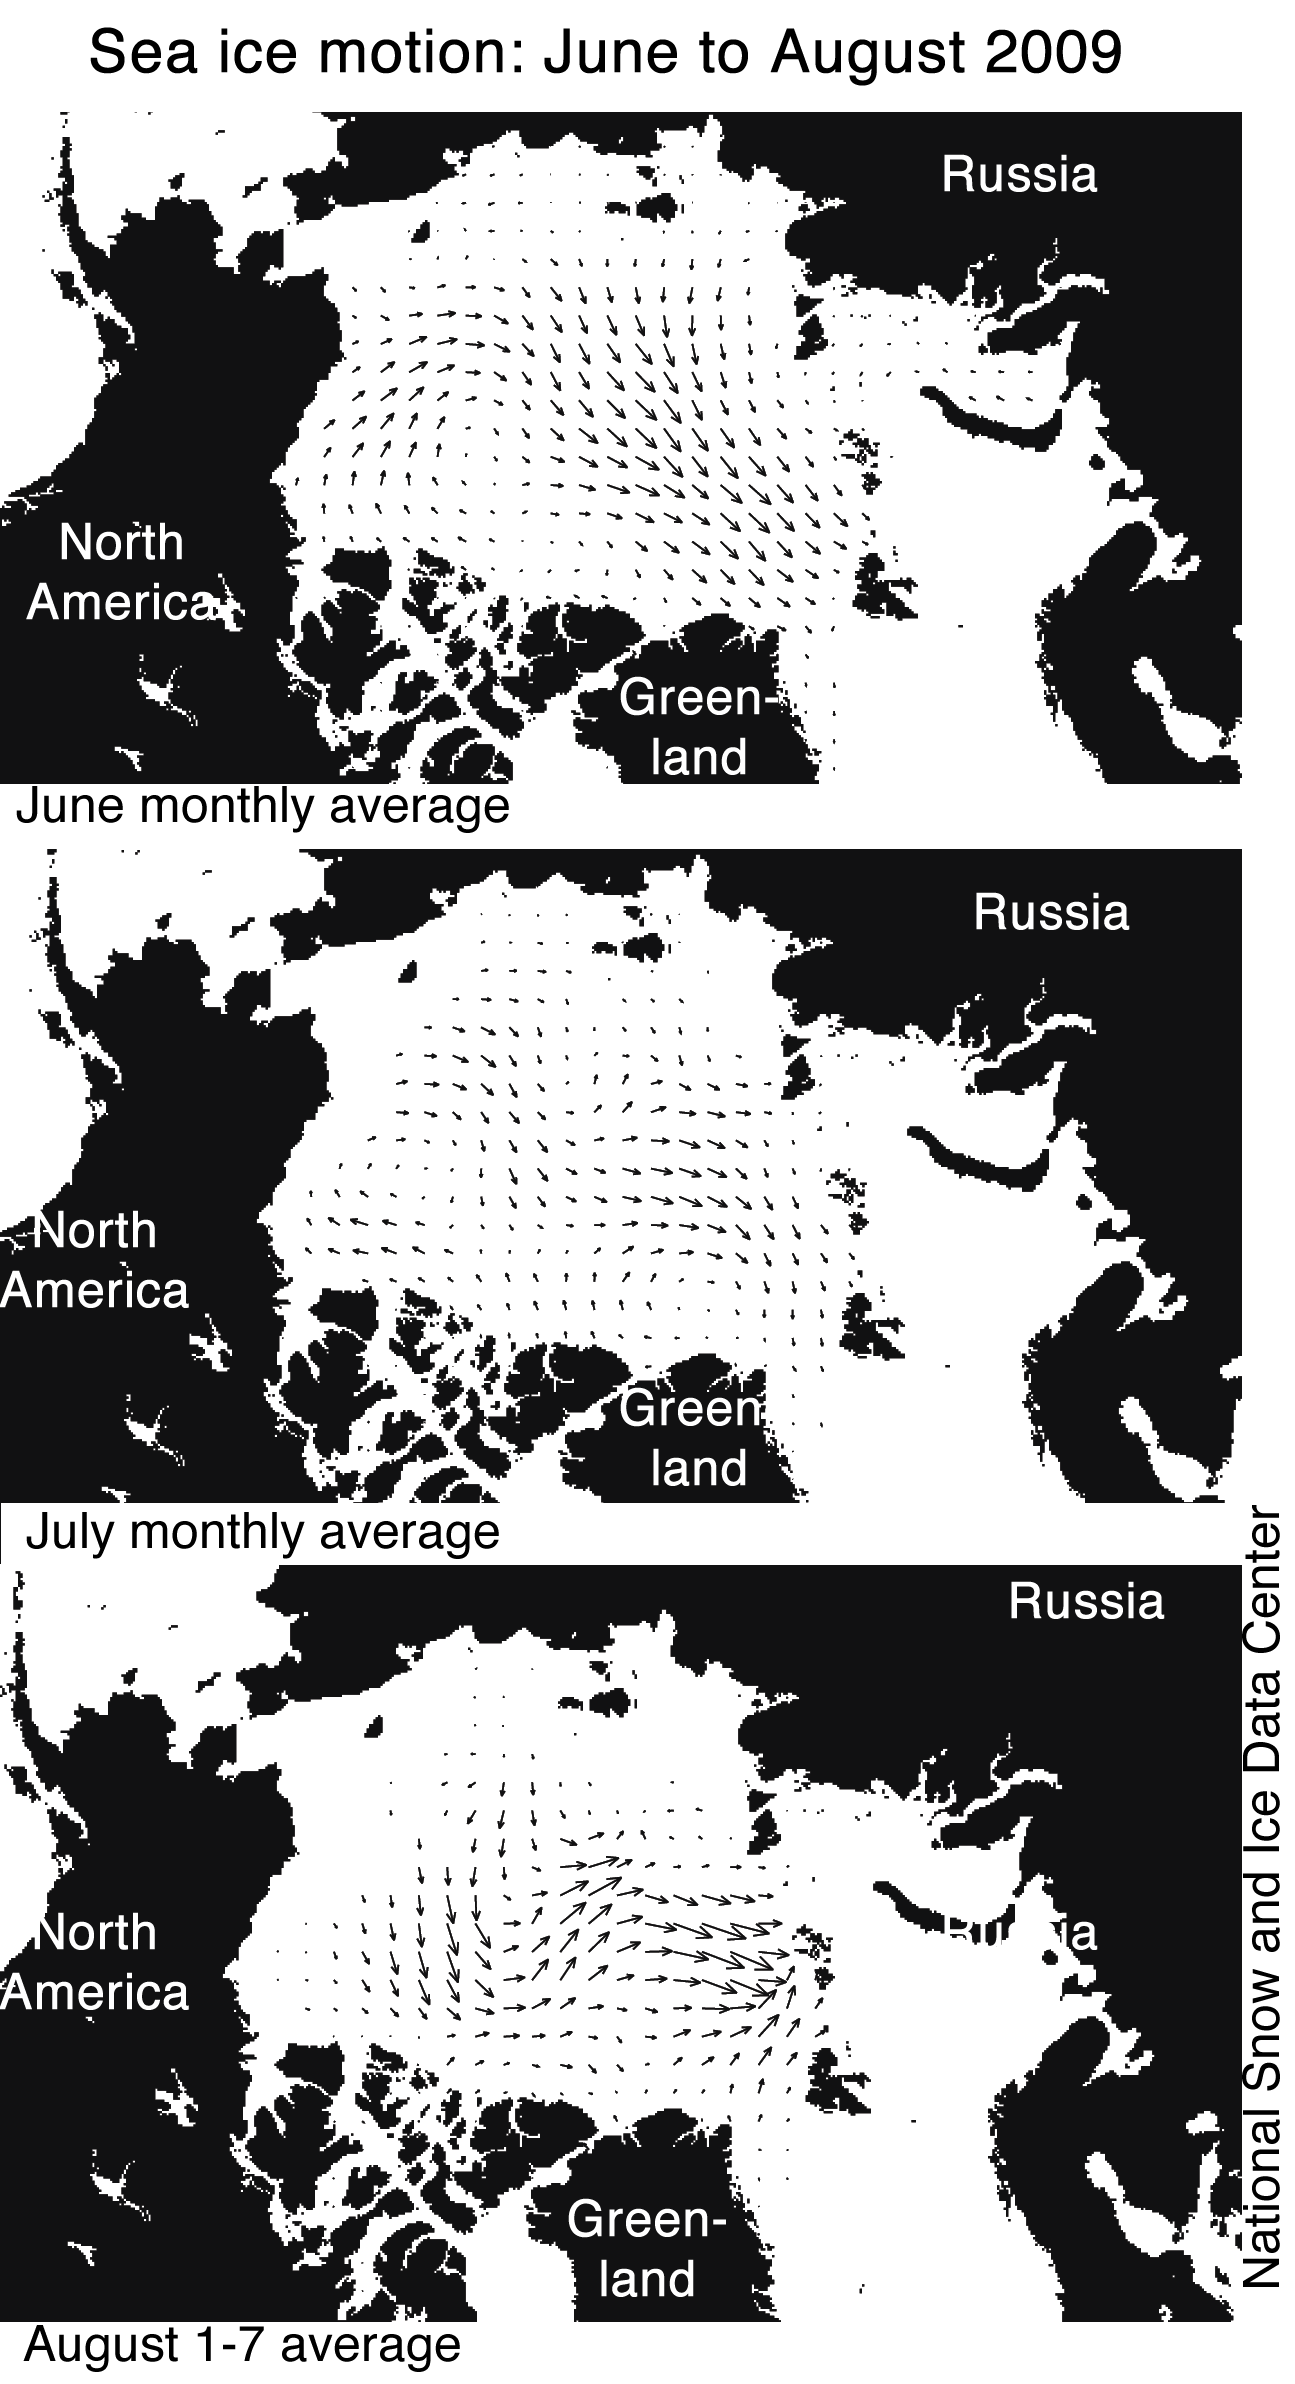
average monthly data from 1979-2009 for July Figure 3. Sea ice motion, derived from AMSR-E data and averaged for June, July, and the first week of August 2009 (the most recent data available), shows a recent change, with ice motion towards the eastern Siberian coast and little export of ice out of the Arctic Ocean via Fram Strait. —Credit: National Snow and Ice Data Center. High-resolution image

Ice motion changes in August

A recent atmospheric circulation pattern, which led to a change in ice motion, caused the ice loss rate to slow down significantly in the first two weeks of August. As discussed in the August 4 post, during much of June and July, a strong Beaufort Sea high-pressure pattern promoted winds that helped push ice out of the Siberian coastal seas, and also brought clear skies and warm temperatures that helped induce melt.

Toward the end of July, the atmospheric pattern changed. Averaged over the past two weeks, a high-pressure system has been centered over the Barents Sea, with low pressure centered over the Laptev Sea. In accordance with Buys Ballot's Law, this pattern led to winds that redirected the motion of the ice cover, pushing the ice edge outward toward the Siberian coast and discouraging ice from exiting the Arctic Ocean through Fram Strait.

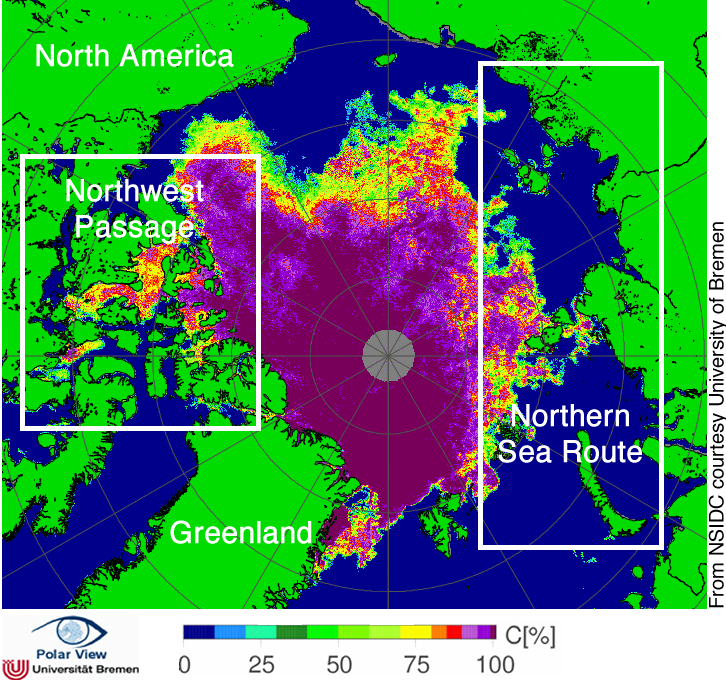
map of arctic showing sea level pressure and atmospheric circulation patterns Figure 4. The map of sea ice concentration from AMSR-E from August 16, 2009, shows ice clogging many of the channels of the Canadian Archipelago. The Northern Sea Route may be clear in the next few weeks. NASA AMSR-E data. —Credit: From National Snow and Ice Data Center, courtesy IUP, University of Bremen, Germany. High-resolution image

The Northwest Passage and Northern Sea Route

So far this year, neither the Northwest Passage nor the Northern Sea Route has opened. The Northern Sea Route appears likely to open soon, but ice still clogs many of the channels in the Northwest Passage.

Whether or not the navigational passages through the Arctic Ocean will open in a given summer depends on atmospheric circulation and ice thickness. For example, although 2007 was a record low extent in the Arctic and the Northwest Passage was nearly completely open, the Northern Sea Route was still choked with ice because of a circulation pattern that pushed a tongue of ice against the Siberian coast. Recent research by Stephen Howell at the University of Waterloo in Canada shows that whether the Northwest Passage clears depends less on how much melt occurs, and more on whether multi-year sea ice is pushed into the channels. Counterintuitively, as the ice cover thins, ice may flow more easily into the channels, preventing the Northwest Passage from regularly opening in coming decades.

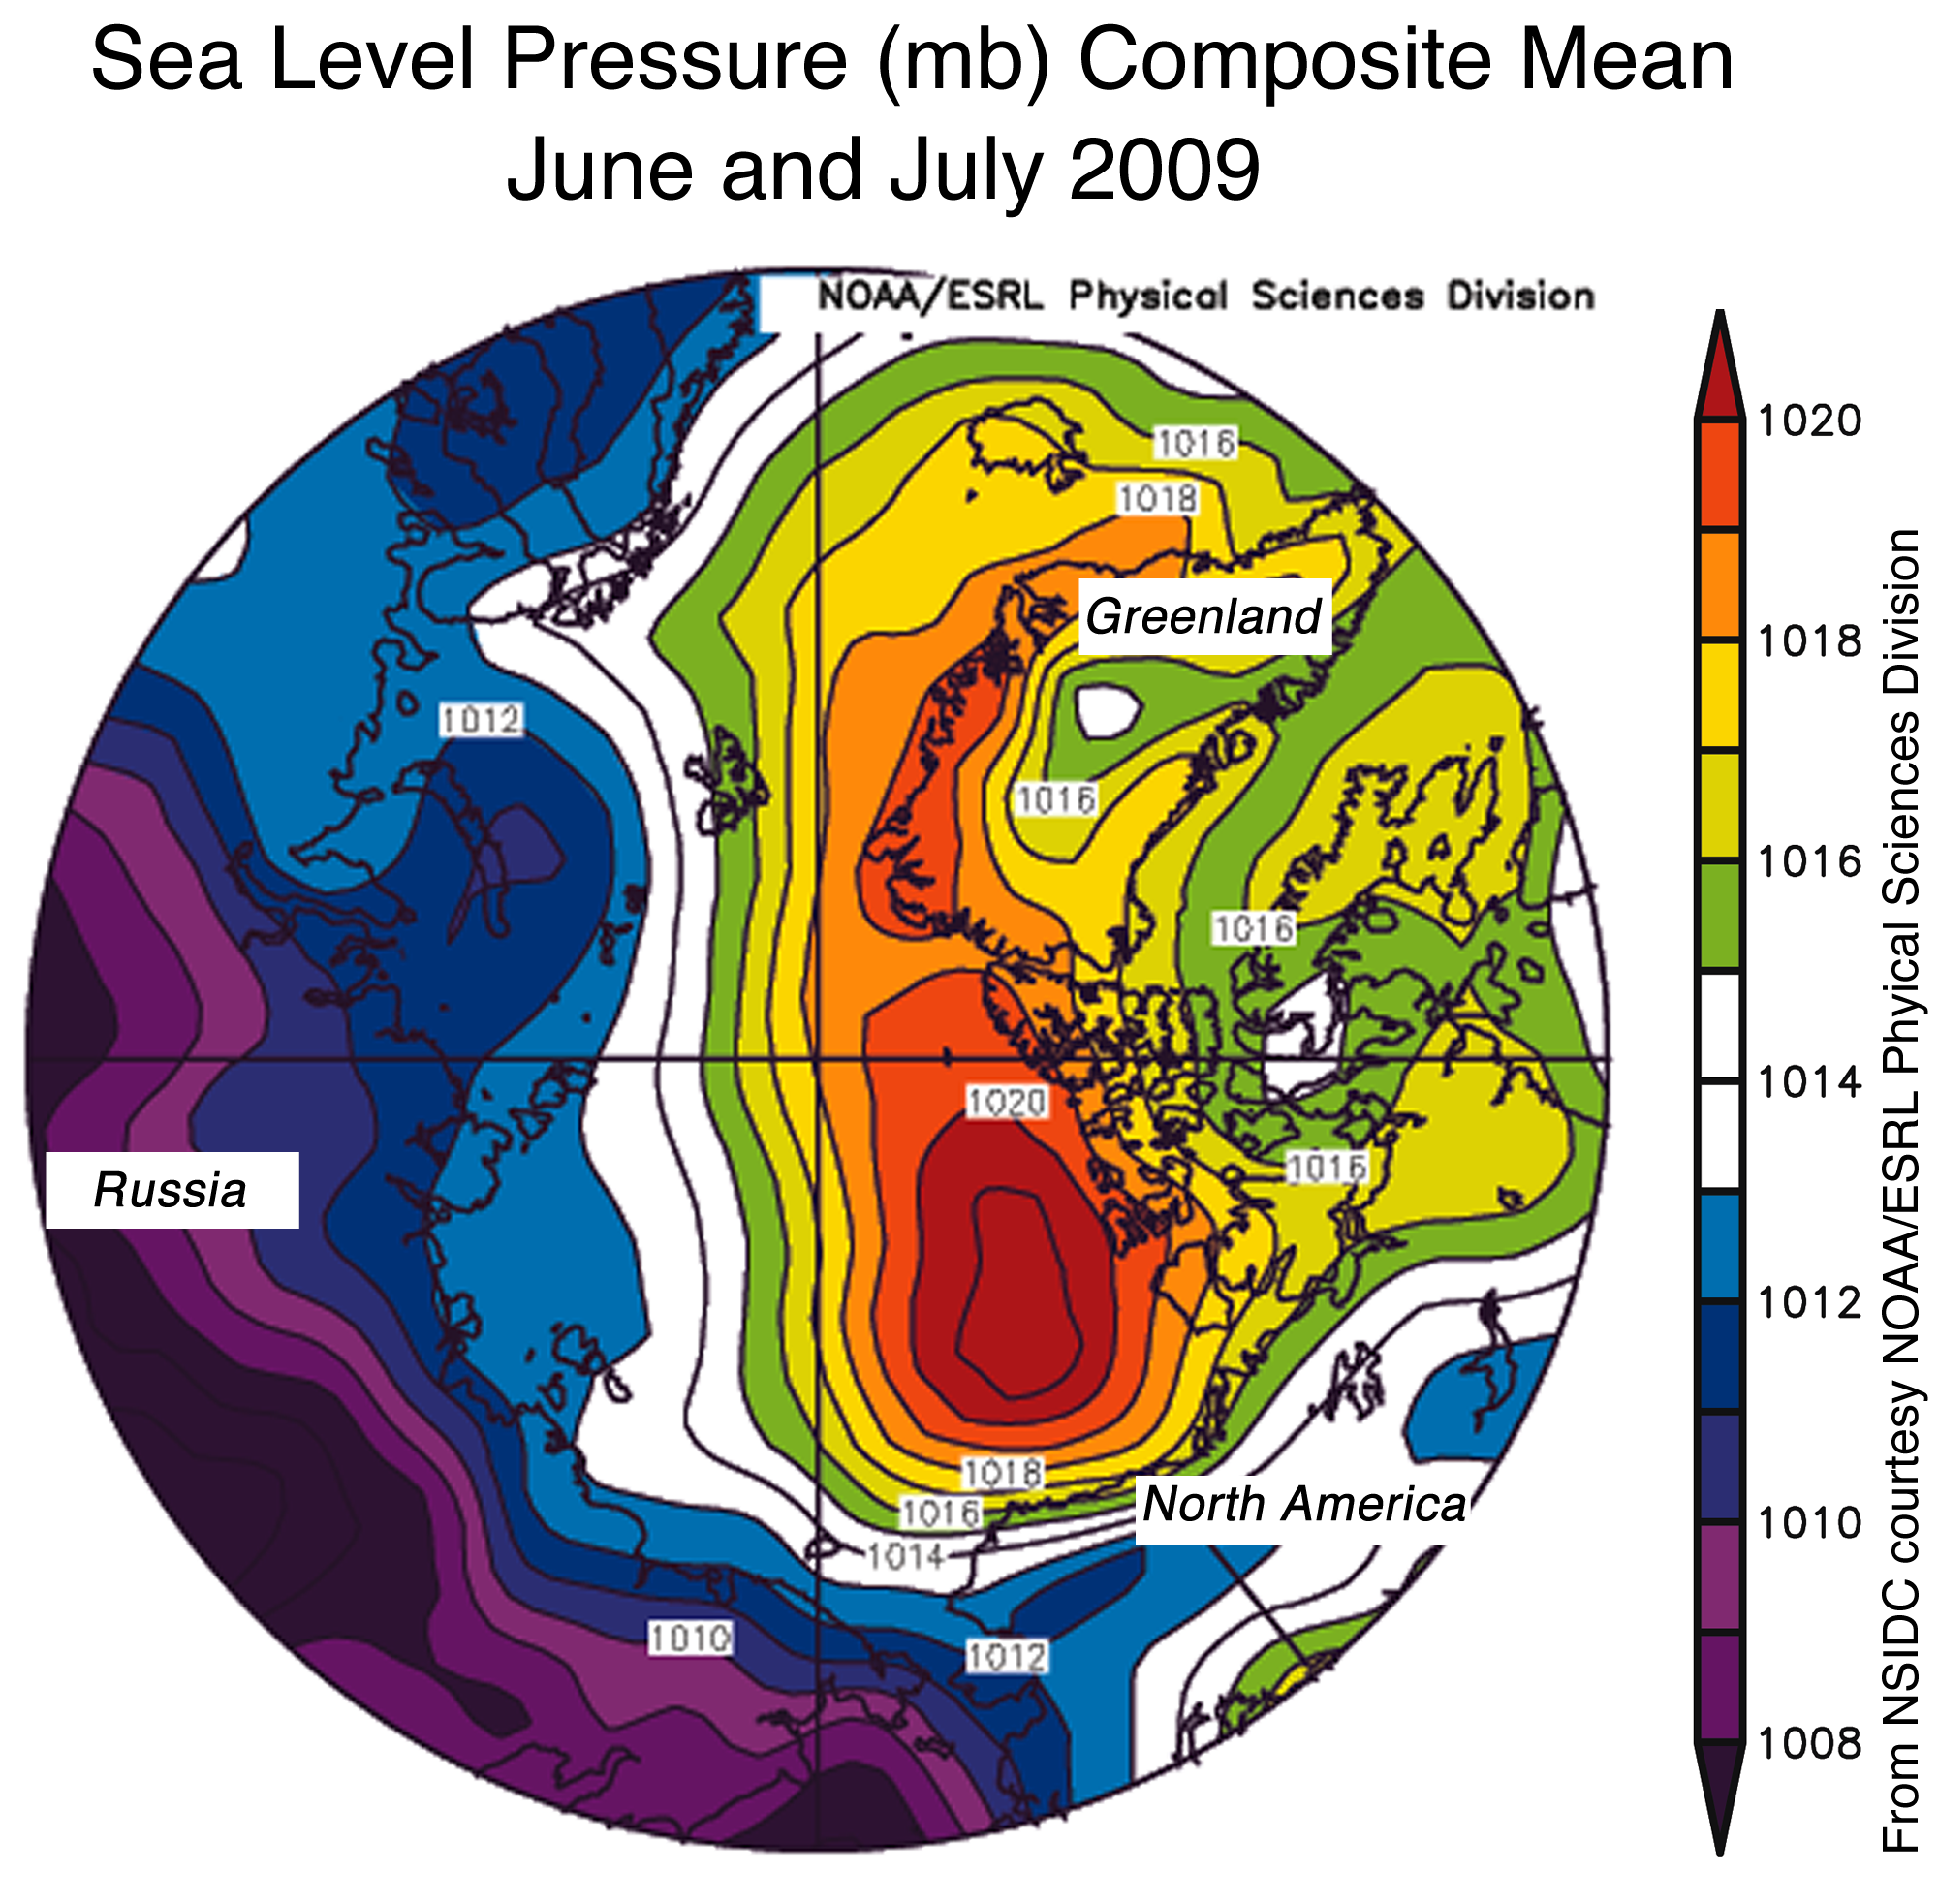
ice thickness from submarinesFigure 4. The map of sea level pressure (in millibars) from June and July 2009 shows a strong high-pressure cell over the Beaufort Sea, similar to the pattern in 2007. In the past, such patterns were rare. —Credit: From National Snow and Ice Data Center, courtesy NOAA/ESRL Physical Sciences Division. High-resolution image

Comment on atmospheric circulation patterns

James Overland of the NOAA Pacific Marine Environmental Laboratory in Seattle, Washington, has taken a close look at patterns of atmospheric circulation in recent summers. Overland notes that the periods June through August 2007 and June and July 2009 both saw an unusual atmospheric pattern of sea level pressure, with higher pressure on the Alaskan side of the Arctic and lower pressure on the Eurasian side. This pressure difference brought warm air into the central Arctic and transported sea ice towards the Atlantic. Historically, such a pattern is a rare event—before 2007, it only occurred twice in 30 years. Normally, there is little difference in pressure across the Arctic during summer, and winds are slack.

This rare condition may result from the convergence of the three main patterns of climate variability: the Arctic Oscillation (AO) climate pattern, which features either high or low pressure over most of the Arctic; the positive phase of the Pacific North American (PNA) pattern, which is characterized by low pressure over the Bering Sea and high pressure over the Canadian Rockies; and the Arctic dipole pattern, which features high pressure on one side of the Arctic and low pressure on the other. In 2007 and 2009 all three patterns have been in play. A clue to the cause of these unusual conditions comes from the wind flow in the middle atmosphere. Normally winds flow in a counter-clockwise direction around the central Arctic Ocean, a flow known as the polar vortex. In the summers of 2007 and 2009 the polar vortex shifted to mostly to the Eurasian side of the Arctic, allowing higher pressures to develop on the Alaskan side. Scientists are now studying whether this dipole pattern will become more common in the future and whether the loss of summer sea ice itself is helping to make this pattern more frequent.

References

Howell, S. E. L., C. R. Duguay, & T. Markus. 2009. Sea ice conditions and melt season duration variability within the Canadian Arctic Archipelago: 1979–2008, Geophys. Res. Lett., 36, L10502; doi: 10.1029/2009GL037681.

Overland, J. E., & M. Wang. 2005. The third Arctic climate pattern: 1930s and early 2000s. Geophys. Res. Lett., 32(23), L23808; doi: 10.1029/2005GL024254.

Wang, M., N. A. Bond, & J. E. Overland. 2007. Comparison of atmospheric forcing in four sub-arctic seas. Deep-Sea Research II, 54, 2543-2559; doi: 10.1016/j.dsr2.2007.08.014

Wang et al., GRL, 36 (2009), Is the Dipole Anomaly a major driver to record lows in Arctic summer sea ice extent?

Geophysical Research Letters, 36 (2009) L05706; doi: 10.1029/2008GL036706.

Is the Dipole Anomaly a major driver to record lows in Arctic summer sea ice extent?

Jia Wang (Great Lakes Environmental Research Laboratory, NOAA, Ann Arbor, MI, U.S.A.), Jinlun Zhang (Polar Science Center, Applied Physics Laboratory, University of Washington, Seattle, WA, U.S.A.), Eiji Watanabe (International Arctic Research Center, University of Alaska Fairbanks, Fairbanks, AK, U.S.A.), Moto Ikeda (Graduate School of Environmental Science, Hokkaido University, Sapporo, Japan), Kohei Mizobata (Department of Ocean Sciences, Tokyo University of Marine Science and Technology, Tokyo, Japan), John E. Walsh (International Arctic Research Center, University of Alaska Fairbanks, Fairbanks, AK, U.S.A.), Xuezhi Bai (Cooperative Institute for Limnology and Ecosystems Research, University of Michigan, Ann Arbor, MI, U.S.A.), and Bingyi Wu (Chinese Academy of Meteorological Sciences, Beijing, China)

Abstract

Recent record lows of Arctic summer sea ice extent are found to be triggered by the Arctic atmospheric Dipole Anomaly (DA) pattern. This local, second–leading mode of sea–level pressure (SLP) anomaly in the Arctic produced a strong meridional wind anomaly that drove more sea ice out of the Arctic Ocean from the western to the eastern Arctic into the northern Atlantic during the summers of 1995, 1999, 2002, 2005, and 2007. In the 2007 summer, the DA also enhanced anomalous oceanic heat flux into the Arctic Ocean via Bering Strait, which accelerated bottom and lateral melting of sea ice and amplified the ice–albedo feedback. A coupled ice–ocean model was used to confirm the historical record lows of summer sea ice extent.

Received 17 November 2008, accepted 28 January 2009, published 6 March 2009.

Citation: Wang, J., J. Zhang, E. Watanabe, M. Ikeda, K. Mizobata, J. E. Walsh, X. Bai, & B. Wu (2009), Is the Dipole Anomaly a major driver to record lows in Arctic summer sea ice extent?, Geophysical Researcg Letters, 36, L05706; doi: 10.1029/2008GL036706.

Link to abstract: http://www.agu.org/pubs/crossref/2009/2008GL036706.shtml