Showing posts with label Arctic Oscillation. Show all posts

James Hansen, international climate scientist, visits University of North Carolina

International climate scientist visits UNC

by DeLene Beeland, February 2, 2010
Dr. James Hansen
Dr. James Hansen

Just as the snow was beginning to melt after one of the worst winter storms to hit the Triangle in recent memory passed, climate scientist James Hansen visited the Univ. of N.C. at Chapel Hill to talk about – you guessed it – global warming.

It’s probably not the first time he’s delivered a speech during wacky weather, and it likely won’t be the last –
Hansen directs NASA’s Goddard Institute for Space Studies, and he is an adjunct professor in the Department of Earth and Environmental Sciences at Columbia University. His visit to the Triangle was courtesy of UNC’s Frey Foundation's Distinguished Visiting Professor Lecture Series. Before his Monday evening lecture, Hansen met with UNC students studying climate change policy in a course taught by environmental policy professor Richard Andrews. Today, he will speak to an undergraduate class studying rivers and global change, taught by Brent McKee, professor and Chair of Marine Sciences.

Hansen has become the public face of climate change science and policy. His outspoken criticism of political solutions for limiting greenhouse gas emissions, such as cap-and-trade systems, has earned him as many friends as it has foes. In recent years, he has moved from the realm of science into advocacy, with no apologies. Perhaps most famously he was arrested on June 23, 2009, along with 31 other protesters “on charges of obstructing officers and impeding traffic during a protest against mountaintop mining,” according to New York Times reporter Andy Revkin’s post on his blog, Dot Earth. The West Virginia protest lives on at YouTube:


But his tone on Monday night was subdued. Even understated. He said the reason he has chosen to speak out so loudly is that he wants his grandkids to know that given all he understands about climate change, he tried to help the public understand, too. He wants them to know he gave it his best.

The core of his public talk focused on the now-familiar mechanics of what scientists know about climate change and how they know it. He discussed how paleo-climatology informs scientists studying modern global trends and those building models that predict future trends. He talked about long-term trends on land and in the deep ocean, and how interplanetary forces affect the Earth’s oscillations and exposure to the Sun’s light.

“There is a gap between what scientists understand and what the public knows,” Hansen said. Personally, I’d flip that around to: there is a gap between what scientists know and what the public understands (or think they know).

Looking to the past, he described a time 50 million years ago when the earth was ice free, and there were about 1,000 parts per million (ppm) of carbon dioxide (CO2) in the atmosphere. Our current levels are at about 385 ppm, dangerously near a tipping point, he said. He discussed how India colliding with Asia churned up carbonate from the seafloor, causing a massive, natural, climate-change forcing. But even this major event pales in comparison with what is in the pipeline, he says. It caused a change of only about 0.0001 ppm/yr of atmospheric CO2 [blogger's note:  see reference and link below -- a very interesting study!], whereas anthropogenic sources today are causing an increase of about 2 ppm per year.

In graph after graph, he showed upward trending greenhouse gases and temperatures. The only downward trending graph was that of the loss of mass in large ice sheets like those on Greenland and Antarctica.

“To preserve creation on this planet, similar to what civilization developed in,” humanity will need to target CO2 reductions to get to less than 350 ppm, he said. Reaching that target is a matter of great political debate and divisiveness. Hansen does not favor cap-and-trade systems and instead advocates for a fee–dividend system, which he says is “designed to benefit the public rather than Wall Street.” Under this system, fossil-fuel companies would pay a carbon fee on the first sale of oil, gas and coal at the mine, wellhead or port of entry. This fee would be divvied up to the public, monthly, deposited electronically in people’s bank accounts.

Don’t hold your breath waiting for this to materialize in the legislature, though; even Hansen admits the current political system is entrenched in trying to move cap-and-trade systems forward, although some say they likely won’t do much to decrease net greenhouse gas emissions.

The bottom line is that as long as fossil fuels are the cheapest form of energy, their use will continue and even increase, Hansen said. So he advocates for a fundamental revamping of our energy sources away from carbon-based fuels, of which coal is the dirtiest, which circles back to why this understated, eloquent and extremely smart man ended up in handcuffs last summer due to civil unrest: he was protesting mountain-top-removal mining which removes entire mountain tops to get to coal beds. Massey Energy is one of the largest companies engaged in this practice, and Hansen and other protesters were attempting to enter its property in West Virginia.

Hansen is one of the few scientists willing to step so deliberately into the public sphere, and on Monday night he drove home his conviction that the only solution to climate change is a political one driven by policy.

“We don’t have a political leader who will stand up and say, ‘This is an injustice,’ ” Hansen said.

As for the recent foul weather? Hansen says it is the result of an extreme phase of  the “Arctic oscillation” – the result a weakening of the jet stream that typically keeps Arctic air locked down around the poles, which allows frigid air to leak out and be replaced by warmer air.

“The Arctic has been warmer than normal, while it was colder than normal here,” he said. “Don’t look for this to happen again soon – it’s been three decades since we’ve seen a phase as extreme as this one.”

Link:   http://scienceinthetriangle.org/2010/02/international-climate-scientist-visits-unc/

James Hansen on David Letterman:

A Conversation with James Hansen:

Storms of my grandchildren, a book by James Hansen
NY Times Opinion Column on Cap-and-Trade system
UNC’s Powering a Nation multimedia on the energy crisis and Appalachian mountain-top-removal coal mining

Study on the production of CO2 by subduction during the colliding of India with Asia:

Proceeding of the National Academy of Sciences (October 21, 2008), 105(42),  16065–16070. Published online 2008 September 22, 2008; doi: 10.1073/pnas.0805382105.

Geology -- Inaugural Article
Equatorial convergence of India and early Cenozoic climate trends
Dennis V. Kent* and Giovanni Muttoni§
*Department of Earth and Planetary Sciences, Rutgers University, Piscataway, NJ 08854;
Lamont-Doherty Earth Observatory, Palisades, NY 10964;
§Department of Earth Sciences, University of Milan, via Mangiagalli 34, I-20133 Milan, Italy; and
Alpine Laboratory of Paleomagnetism, via Madonna dei Boschi 76, I-12016 Peveragno, Italy
Correspondence e-mail: dvk@rutgers.edu
Link to full, open-access article:  http://www.ncbi.nlm.nih.gov/pmc/articles/PMC2570972/

NOAA's National Weather Service's Climate Prediction Center's forecast for the Arctic Oscillation for the next 7-14 days, from January 12, 2010

NOAA's National Weather Service's Climate Prediction Center's forecast for the Arctic Oscillation for the next 7-14 days, from January 12, 2010


The daily AO indices are shown for the previous 120 days. The indices are standardized by standard deviation of the observed monthly AO index from 1979-2000.

The values at the upper left and right corner of each figure indicate the mean value of the AO index and the correlation coefficients between the observation and the forecasts, respectively.

 
GFS Arctic Oscillation Outlooks
 

Link:  http://www.cpc.noaa.gov/products/precip/CWlink/daily_ao_index/ao_index_mrf.shtml

Arctic Oscillation Index, Surface Temperature Anomalies, Polar Vortex, Chris Mooney's "Water World"

Dear Readers,

Here is a link to an animation of the past 30 days' surface temperature anomalies (note the red color over Greenland):


http://www.esrl.noaa.gov/psd/map/images/fnl/sfctmpmer_01a_30frames.fnl.anim.html


Here is a link to NASA's Earth Observatory of how hot air was belched out into the stratosphere over the North Pole in February 2009 (the 7-Mb animation takes a very long time to load, but I guarantee you it is worth the wait and is scary to watch).


Link to NASA article:


http://earthobservatory.nasa.gov/IOTD/view.php?id=36972


Link to QuickTime animation (by way of explanation, please note that the image on the right shows temperatures at an altitude of about 30 kilometers. The temperatures begin at a low of negative 88 degrees centigrade (-88 °C).  As the heat is belched through the polar vortex, splitting it in two, temperatures rise to a positive 12 degrees centigrade (+12 °C) . Note also that the heat is coming from the southern latitudes just north of the equator.):


http://earthobservatory.nasa.gov/images/imagerecords/36000/36972/npole_gmao_200901-02.mov


Here is a link to NOAA's National Weather Service's Climate Predition Center's daily graph of the Arctic Oscillation Index:


http://www.cpc.noaa.gov/products/precip/CWlink/daily_ao_index/ao_index.html


Graph as of January 6, 2009:


Observed Daily Arctic Oscillation Index.


And, just for fun, boys and girls, a link to the Western Hemisphere and (some of the Eastern) water vapor streams over the past 24 hours:


http://cimss.ssec.wisc.edu/tropic/real-time/mosaic/movies/moswwvbbm/moswwvbbmjava.html


And, a quote from Chris Mooney's book "Storm World" (page 57) that Susan A. was so kind to send to me:


"The 'most important and obvious' positive feedback identified in the Charney report involved atmospheric water vapor. Due to a physical law known as the Clausius-Clapeyron equation, the amount of moisture that can be carried by the air increases along a steeply sloping curve as temperature rises."


Emphasis and underlining are mine.

Richard Black of the BBC: Arctic roots of 'upside-down' weather (on the unusually extremely negative Arctic Oscillation)

Arctic roots of 'upside-down' weather

Richard Black | 14:01 UK time, BBC News, Tuesday, 5 January 2010
Tartan_modelled_in_snowIt's cold in Kirkcaldy, freezing in Frankfurt and brass monkeys in Bryn Mawr... a winter spell with weather that's unusually -- well -- wintry.

But not everywhere; in fact, other places in the Northern Hemisphere are seeing weather that's unseasonably warm.

In Goose Bay in Newfoundland, it's barely getting below 0 °C -- bikini weather, relatively speaking, given that the average minimum for January is -23 °C.

The cause of what one weather service refers to as these "upside down" conditions is an extreme of the Arctic Oscillation (AO).

Essentially, air pressure is measured at various places across the Arctic and at the middle latitudes of the Northern Hemisphere -- about 45°N, roughly the latitude of Milan, Montreal or Vladivostok.

The difference between the average readings for the two latitudes gives the state of the Arctic Oscillation index.

A "positive" state is defined as relatively high pressure in mid-latitudes and relatively low pressure over the polar region. "Negative" conditions are the reverse.

And what we have at the moment is an unusually extreme negative state.

The graph below comes from the US government's Climate Prediction Center and shows the variability of the index from 1950 to 2009.
Arctic_Oscillation_indexThe text on the graph is a little unclear as I've had to shrink it a bit, but you can see at the bottom right the current negative conditions developing during December -- and here's the original.

Over at the New York Times, they've compiled a different graph that shows how extreme these few weeks are turning out to be -- unmatched since the early 1960s, a period that saw several winters in the UK featuring extended spells of cold, snowy weather.

What the negative AO conditions mean is that cold air spills out of the Arctic down to mid-latitudes, which this time round includes much of Europe, tracts of the US and China.

For the UK, this implies a higher chance of cold northerly or easterly winds.

But if you live in places that are usually cold at this time of year -- such as Goose Bay -- you'll see a concomitant rise in temperatures compared with what happens during "positive" AO conditions, when the cold air is confined to more northerly latitudes.

Ball_game_played_in_snow_in_ChinaA little more than a decade ago, I visited Yakutsk in Siberia which lies close to one of the candidates for the title of "coldest place on the planet" -- the village of Oymyakon, which has seen the mercury plummet as low as -71 °C.

I don't know how balmy it is in Oymyakon right now but in Yakutsk itself, the daily minimum is a mere -35 °C -- that's 10 °C warmer than the January average.

Despite the name "Arctic Oscillation," there's little discernible pattern to how the pressure difference varies, or what causes it -- perhaps "Arctic Random Fluctuation" would be a better name.

Some researchers have linked an apparent increase in the average state of the index from the 1960s to the 1990s to man-made global warming, but you would have to say the jury is definitely still out.
 
(The AO is linked to another naturally varying phenomenon, by the way -- the North Atlantic Oscillation (NAO), the variability in the pressure difference between Iceland and the Azores - in fact, some hold that the NAO is just a sub-set of the AO.)

So the question of how long the unusually wintry UK conditions will last is really a question of how long the Arctic Oscillation will remain in its extreme negative state -- and a week to 10 days seems to be the favoured timescale.

Link:  http://www.bbc.co.uk/blogs/thereporters/richardblack/2010/01/arctic_conditions_arctic_cause.html

Extraordinary September Arctic sea ice reductions and their relationships with storm behavior over 1979–2008

Geophysical Research Letters, 36 (2009) L19715; doi: 10.1029/2009GL039810.

Extraordinary September Arctic sea ice reductions and their relationships with storm behavior over 1979–2008

Ian Simmonds and Kevin Keay (School of Earth Sciences, The University of Melbourne, Victoria, Australia)

Received 29 June 2009; accepted 1 September 2009; published 14 October 2009

Abstract

Dramatic changes have been observed in Arctic sea ice, cyclone behavior and atmospheric circulation in recent decades. Decreases in September ice extent have been remarkable over the last 30 years, and particularly so in very recent times. The analysis reveals that the trends and variability in September ice coverage and mean cyclone characteristics are related, and that the strength (rather than the number) of cyclones in the Arctic basin is playing a central role in the changes observed in that region, especially in the last few years. The findings reinforce suggestions that the decline in the extent and thickness of Arctic ice has started to render it particularly vulnerable to future anomalous cyclonic activity and atmospheric forcing.

K. Delthloff et al.,The climate system of the Earth from a polar perspective

Nuuk Climate Days 2009: Changes of the Greenland Cryosphere Workshop & The Arctic Freshwater Budget International Symposium, Nuuk, Greenland, 25-27 August 2009


Primary author: DELTHLOFF, Klaus (Alfred Wegener Institute for Polar and Marine Research (AWI),
Germany), Klaus.Dethloff@awi.de.  Co-authors: RINKE, A. (Alfred Wegener Institute for Polar and Marine Research); HANDORF, D. (Alfred Wegener Institute for Polar and Marine Research); DORN, W. (Alfred Wegener Institute for Polar and Marine Research); BRAND, S. (Alfred Wegener Institute for Polar and Marine Research); MIELKE, M. (Alfred Wegener Institute for Polar and Marine Research); GRAESER, J (Alfred Wegener Institute for Polar and Marine Research); HERBER, A. (Alfred Wegener Institute for Polar and Marine Research)

Abstract ID: F1

The climate system of the Earth from a polar perspective


Balloon and radio sounding data from the North Pole drifting station NP35 for autumn 2007 to spring 2008 have been used to evaluate numerical model outputs (simulations with the regional climate model HIRHAM, ECMWF analyses). HIRHAM in the climate mode has some difficulty to represent the observed complex temperature profile, while the forecast mode shows better agreement. Sensitivity experiments concerning the atmospheric initial state, sea ice thickness and planetary boundary layer parameterization demonstrate improvements in the simulations.

Similar measurements have been carried out during spring 2009 on NP 36 and with the AWI airplane POLAR 5 over the Arctic Ocean. The pilot-project PAM-RCM (Pan-Arctic Measurements and Arctic Regional climate model simulations) provided a unique opportunity to obtain a snapshot of aerosol and cloud distributions and associated meteorological and atmospheric conditions as well as measurements of sea ice thickness in a latitude band between about 70°N and 80°N.

Sensitivity experiments using a coupled regional atmosphere-ocean-ice model of the Arctic has been conducted in order to identify the requirements needed to reproduce observed sea-ice conditions and to address uncertainties in the description of Arctic processes. While more sophisticated schemes for the albedo, the treatment of lateral freezing and melting, and the snow cover have been successfully introduced into the model, the parameterization of clouds is an open issue.

The global influence of Arctic feedbacks connected with sea-ice albedo changes and stratospheric ozone changes have been investigated. The simulations show significant changes over the Arctic and the whole globe due to changes of planetary wave patterns, which trigger the Arctic Oscillation (AO) and influences the sea -ice cover.

The impact of an interactive stratospheric ozone chemistry on the tropospheric circulation has been studied on the basis of the atmosphere-ocean-sea ice general circulation model ECHO-GiSP. The results show a sensitivity of the tropospheric circulation dynamics to the stratospheric chemistry. With enabled interactive stratospheric chemistry the model tends to the negative phase of the AO mode and a more unstable polar vortex..

Contact for symposium information:  Sune Nordentoft Lauritsen, e-mail: snl@space.dtu.dk

Sea Ice Thickness


What this makes clear is that the decline in ice thickness has been ongoing since 1980. Prior work gave us only two points of reference between 1959 and 2000. This is a more detailed study from 1959 on and assures us that the ice loss has been ongoing after 1980 which represented a peak. This is a surprise.

This means that I can ignore the pre 1980 data and focus on the decline since.

The measured thickness has declined by 53% which easily explains the sharp drop in areal extent also. It has all happened in twenty five or so years and is accelerating because the heat been absorbed has progressively less ice to work with. Also the process has not ended yet. Today’s ice I believe is the thinnest yet.

The real point that must be made is that this process has not ended or reversed.

This continues to be the one tangible bit of evidence that is indisputable about so called global warming. It also suggests that we could be on the verge of quite warm Arctic summers. Real vegetation in the Arctic?

This also allows us to fine tune our calculations and we find that multiyear ice will likely be gone in about a decade at most. We are now in the visible melt out phase of this Arctic clearing event. A good wind system like 2007 will also accelerate it just as a strong cooling event will reverse the process.

Which means that the open seas will take a bit longer but not much longer and expect another surprise in the decline of areal extent.

Satellites And Submarines Give The Skinny On Sea Ice Thickness

http://www.terradaily.com/reports/Satellites_And_Submarines_Give_The_Skinny_On_Sea_Ice_Thickness_999.html

http://www.terradaily.com/images/change-sea-ice-thickness-1988-2008-bg.jpg

Patterns of average winter ice thickness from February to March show thicker ice in 1988 (left), compared to thinner ice averaged from 2003-2008 (right). Thickness information in Antarctica is limited to an irregular polygon shape that outlines the area where declassified submarine data are available. Credit: Ronald Kwok/NASA

by Kathryn Hansen

Pasadena CA (SPX) Sep 10, 2009


This summer, a group of scientists and students - as well as a Canadian senator, a writer, and a filmmaker - set out from Resolute Bay, Canada, on the icebreaker Louis S. St-Laurent. They were headed through the Northwest Passage, but instead of opening shipping lanes in the ice, they had gathered to open up new lines of thinking on Arctic science.


Among the participants in the shipboard workshop (hosted by Fisheries and Oceans Canada) was Ron Kwok of NASA's Jet propulsion Laboratory in Pasadena, Calif. Kwok has long provided checkups on the health of Arctic sea ice - the frozen sea water floating within the Arctic Ocean basin. He also knows that some important clues about ice changes can't be seen from a ship.


Extending the Record


While satellites provide accurate and expansive coverage of ice in the Arctic Ocean, the records are relatively new. Satellites have only monitored sea ice extent since 1973. NASA's Ice, Cloud, and land Elevation Satellite (ICESat) has been on the task since 2003, allowing researchers to estimate ice thickness as well.


To extend the record, Kwok and Drew Rothrock of the University of Washington, Seattle, recently combined the high spatial coverage from satellites with a longer record from Cold War submarines to piece together a history of ice thickness that spans close to 50 years.


Analysis of the new record shows that since a peak in 1980, sea ice thickness has declined 53 percent. "It's an astonishing number," Kwok said. The study, published online August 6 in Geophysical Research Letters, shows that the current thinning of Arctic sea ice has actually been going on for quite some time.


"A fantastic change is happening on Earth - it's truly one of the biggest changes in environmental conditions on Earth since the end of the ice age," said Tom Wagner, cryosphere program manager at NASA Headquarters. "It's not an easy thing to observe, let alone predict, what might happen next."


Sea ice influences the Arctic's local weather, climate, and ecosystems. It also affects global climate. As sea ice melts, there is less white surface area to reflect sunlight into space. Sunlight is instead absorbed by the ocean and land, raising the overall temperature and fueling further melting. Ice loss puts a damper on the Arctic air conditioner, disrupting global atmospheric and ocean circulation.


To better identify what these changes mean for the future, scientists need a long-term look at past ice behavior. Each year, Arctic ice undergoes changes brought about by the seasons, melting in the summer warmth and refreezing in the cold, dark winter.


A single extreme melt or freeze season may be the result of any number of seasonal factors, from storminess to the Arctic Oscillation (variations in atmospheric circulation over the polar regions that occur on time scales from weeks to decades).


But climate is not the same as weather. Climate fluctuates subtly over decades and centuries, while weather changes from day to day and by greater extremes.


"We need to understand the long-term trends, rather than the short-term trends that could be easily biased by short-term changes," Kwok said. "Long-term trends are more reliable indicators of how sea ice is changing with the global and regional climate."


That's why a long-term series of data was necessary. "Even decadal changes can be cyclical, but this decline for more than three decades does not appear to be cyclical," Rothrock said.


All the Ice Counts


Arctic sea ice records have become increasingly comprehensive since the latter half of the 20th century, with records of sea ice anomalies viewed from satellites, ships, and ice charts collected by various countries. Most of that record, kept in the United States by the National Snow and Ice Data Center at the University of Colorado, Boulder, describes the areal extent of sea ice.


But a complete picture of sea ice requires an additional, vertical measurement: thickness. Melting affects more than just ice area; it can also impact ice above and below the waterline. By combining thickness and extent measurements, scientists can better understand how the Arctic ice cover is changing.


Kwok and other researchers used ICESat's Geoscience Laser Altimeter System to estimate the height of sea ice above the ocean surface. Knowing the height, scientists can estimate how much ice is below the surface.


Buoyancy causes a fraction (about 10 percent) of sea ice to stick out above the sea surface. By knowing the density of the ice and applying "Archimedes' Principle" - an object immersed in a fluid is buoyed by a force equal to the weight of the fluid displaced by the object - and accounting for the accumulation of snowfall, the total thickness of the ice can be calculated.


In 2008, Kwok and colleagues used ICESat to produce an ice thickness map over the entire Arctic basin. Then in July 2009, Kwok and colleagues reported that multiyear 'permanent' ice in the Arctic Ocean has thinned by more than 40 percent since 2004. For the first time, thin seasonal ice has overtaken thick older ice as the dominant type.


Submarines and Satellites


To put the recent decline in context, Kwok and Rothrock examined the recent five-year record from ICESat in the context of the longer history of ice thickness observed by U.S. Navy submarines.


During the Cold War, the submarines collected upward-looking sonar profiles, for navigation and defense, and converted the information into an estimate of ice thickness. Scientists also gathered profiles during a five-year collaboration between the Navy and academic researchers called the Scientific Ice Expeditions, or "SCICEX," of which Rothrock was a participant. In total, declassified submarine data span nearly five decades-from 1958 to 2000-and cover a study area of more than 1 million square miles, or close to 40 percent of the Arctic Ocean.


Kwok and Rothrock compared the submarine data with the newer ICESat data from the same study area and spanning 2003 to 2007. The combined record shows that ice thickness in winter of 1980 averaged 3.64 meters. By the end of 2007, the average was 1.89 meters.


"The dramatic decrease in multiyear ice coverage is quite remarkable and explains to a large degree the decrease in total ice area and volume," Kwok said.


Rothrock, who has worked extensively with the submarine data, agrees. "This paper shows one of the most compelling signals of global warming with one of the greatest and fastest regional environmental impacts."


Ice Through Human Eyes


While it is critical to keep monitoring the Arctic with satellites and aircraft, Kwok believes there is also a benefit in physically standing in a place and seeing the changes through human eyes-particularly for non-scientists, who do not keep a close watch on sea ice.


The August 2009 workshop in the Northwest Passage brought together an eclectic group of politicians, artists, and scientists to see the ice firsthand. The challenge was to see the problem of a changing Arctic environment from a variety of scientific, political, cultural and human perspectives and to discuss the future of collaborative study in the Arctic. The science of sea ice has implications for people's livelihoods, for long-established ecosystems, and for opening a new part of the world to exploration and exploitation.
The workshop participants now take their experiences and observations back to warmer climates, where there is sometimes less urgency about ice retreat.


"Sea ice is about more than just hard science; it's a geopolitical and human issue," Kwok noted. "There is a big personal impact when you get away from your desk and see it in person."

NSIDC Report of August 18, 2009: A change in ice motion slows seasonal decline

NSIDC Report of August 18, 2009: A change in ice motion slows seasonal decline

During the first half of August 2009, Arctic ice extent declined more slowly than during the same period in 2007 and 2008. The slower decline is primarily due to a recent atmospheric circulation pattern, which transported ice toward the Siberian coast and discouraged export of ice out of the Arctic Ocean. It is now unlikely that 2009 will see a record low extent, but the minimum summer ice extent will still be much lower than the 1979 to 2000 average.

Note: This mid-monthly analysis update shows a single-day extent value for Figure 1, rather than the usual monthly average. While monthly average extent images are more accurate in understanding long-term changes, the daily images are helpful in monitoring sea ice conditions in near-real time.

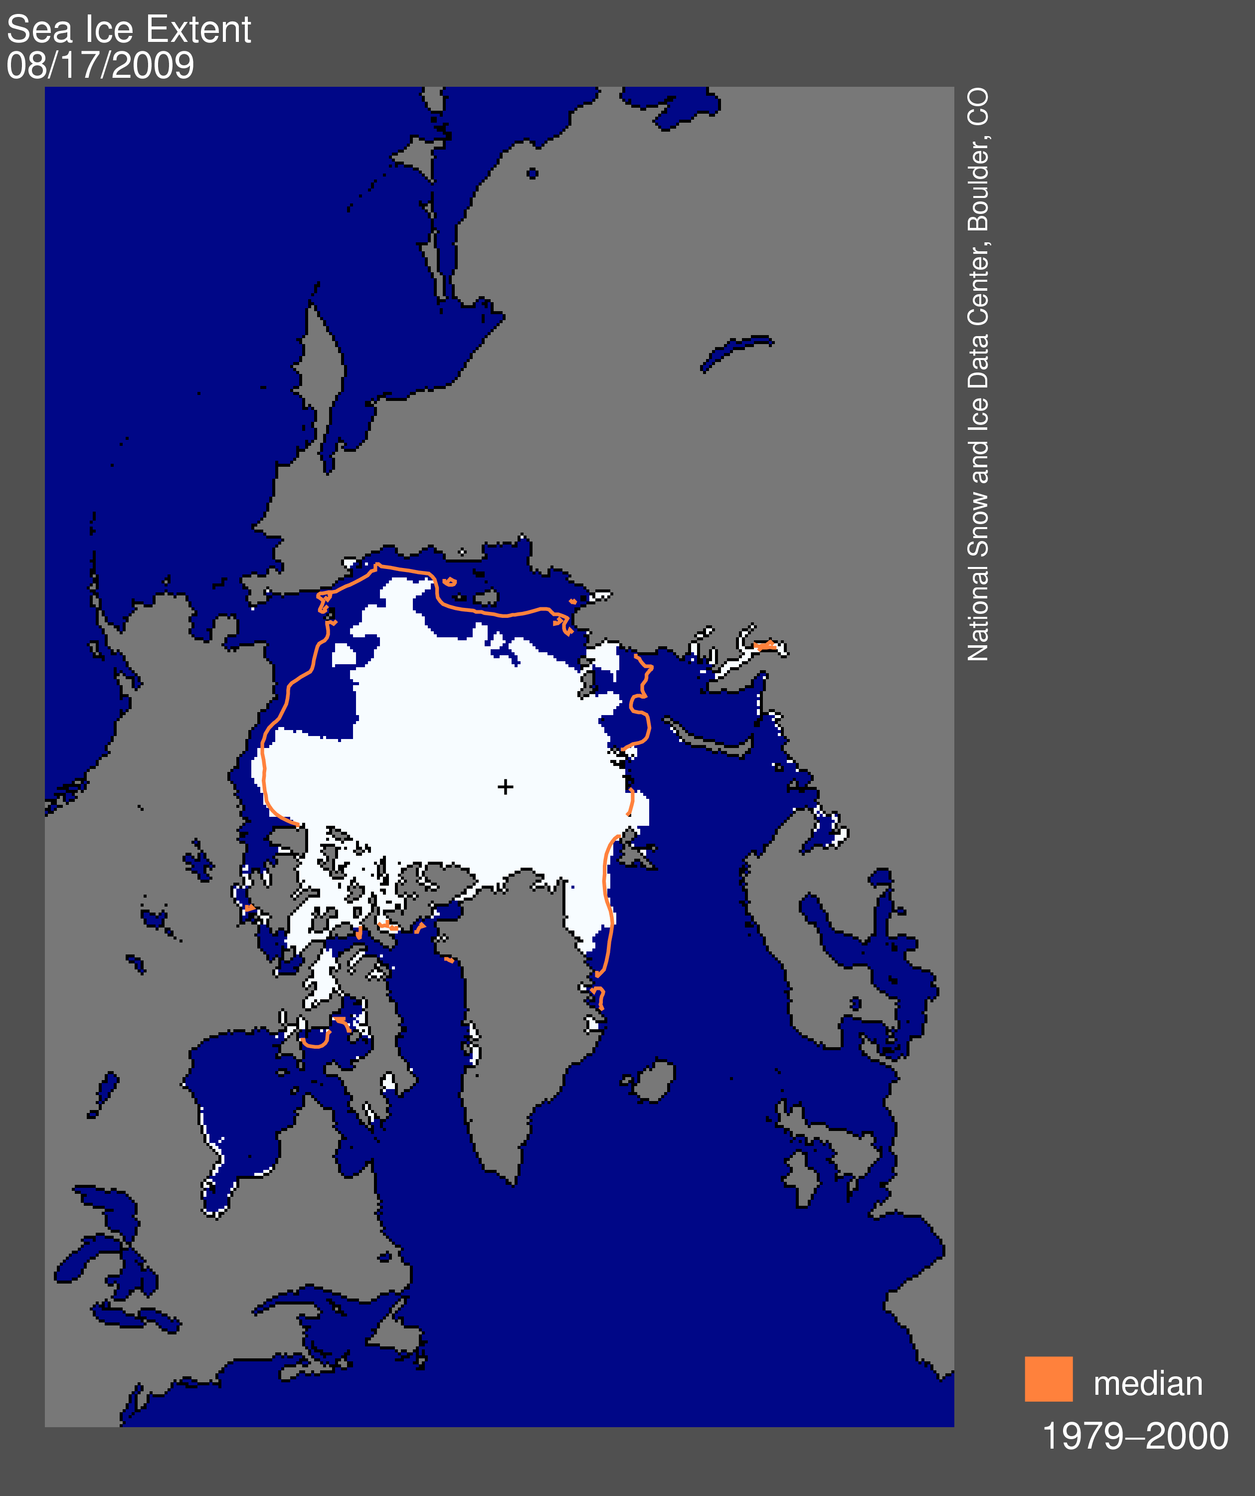
map from space showing sea ice extent, continentsFigure 1. Daily Arctic sea ice extent on August 17, 2009, was 6.26 million km² (2.42 million sq. miles). The orange line shows the 1979-2000 median extent for that day. The black cross indicates the geographic North Pole. Sea Ice Index data. About the data. —Credit: National Snow and Ice Data Center. High-resolution image

Overview of conditions

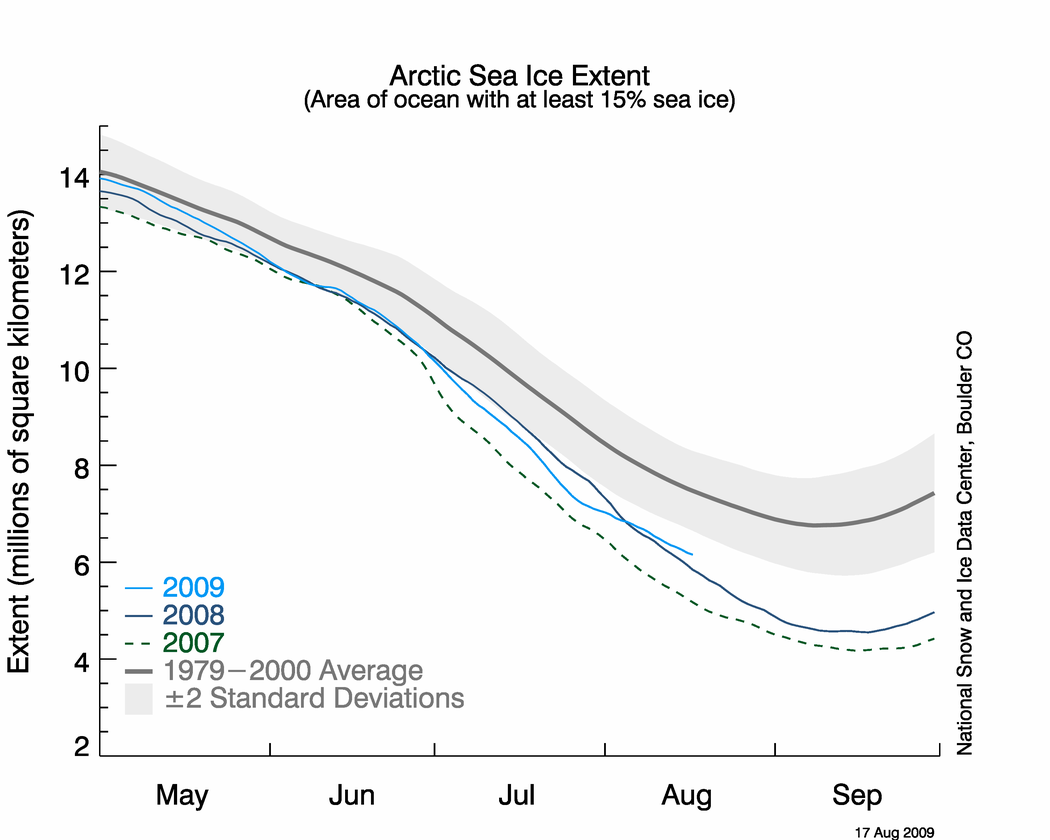
On August 17, 2009, Arctic sea ice extent was 6.26 million km² (2.42 million sq. miles). This is 960,000 km² (370,000 sq. miles) more ice than for the same day in 2007, and 1.37 million km² (530,000 sq. miles) below the 1979-2000 average. On August 8, the 2009 extent decreased below the 1979-2000 average minimum annual extent, with a month of melt still remaining.

graph with months on x axis and extent on y axis Figure 2. The graph above shows daily sea ice extent as of August 17, 2009. The solid light blue line indicates 2009; the solid dark blue line shows 2008; the dashed green line shows 2007; and the solid gray line indicates average extent from 1979 to 2000. The gray area around the average line shows the two standard deviation range of the data. Sea Ice Index data. —Credit: National Snow and Ice Data Center. High-resolution image

Conditions in context

From August 1 to 17, Arctic sea ice extent declined at an average rate of 54,000 km² (21,000 sq. miles) per day. This decline was slower than the same period in 2008, when it was 91,000 km² (35,000 sq. miles) per day, and for the same period in 2007, when ice extent declined at a rate of 84,000 km² (32,000 sq. miles) per day. The recent rate of ice loss has slowed considerably compared to most of July. Arctic sea ice extent is now greater than the same day in 2008.

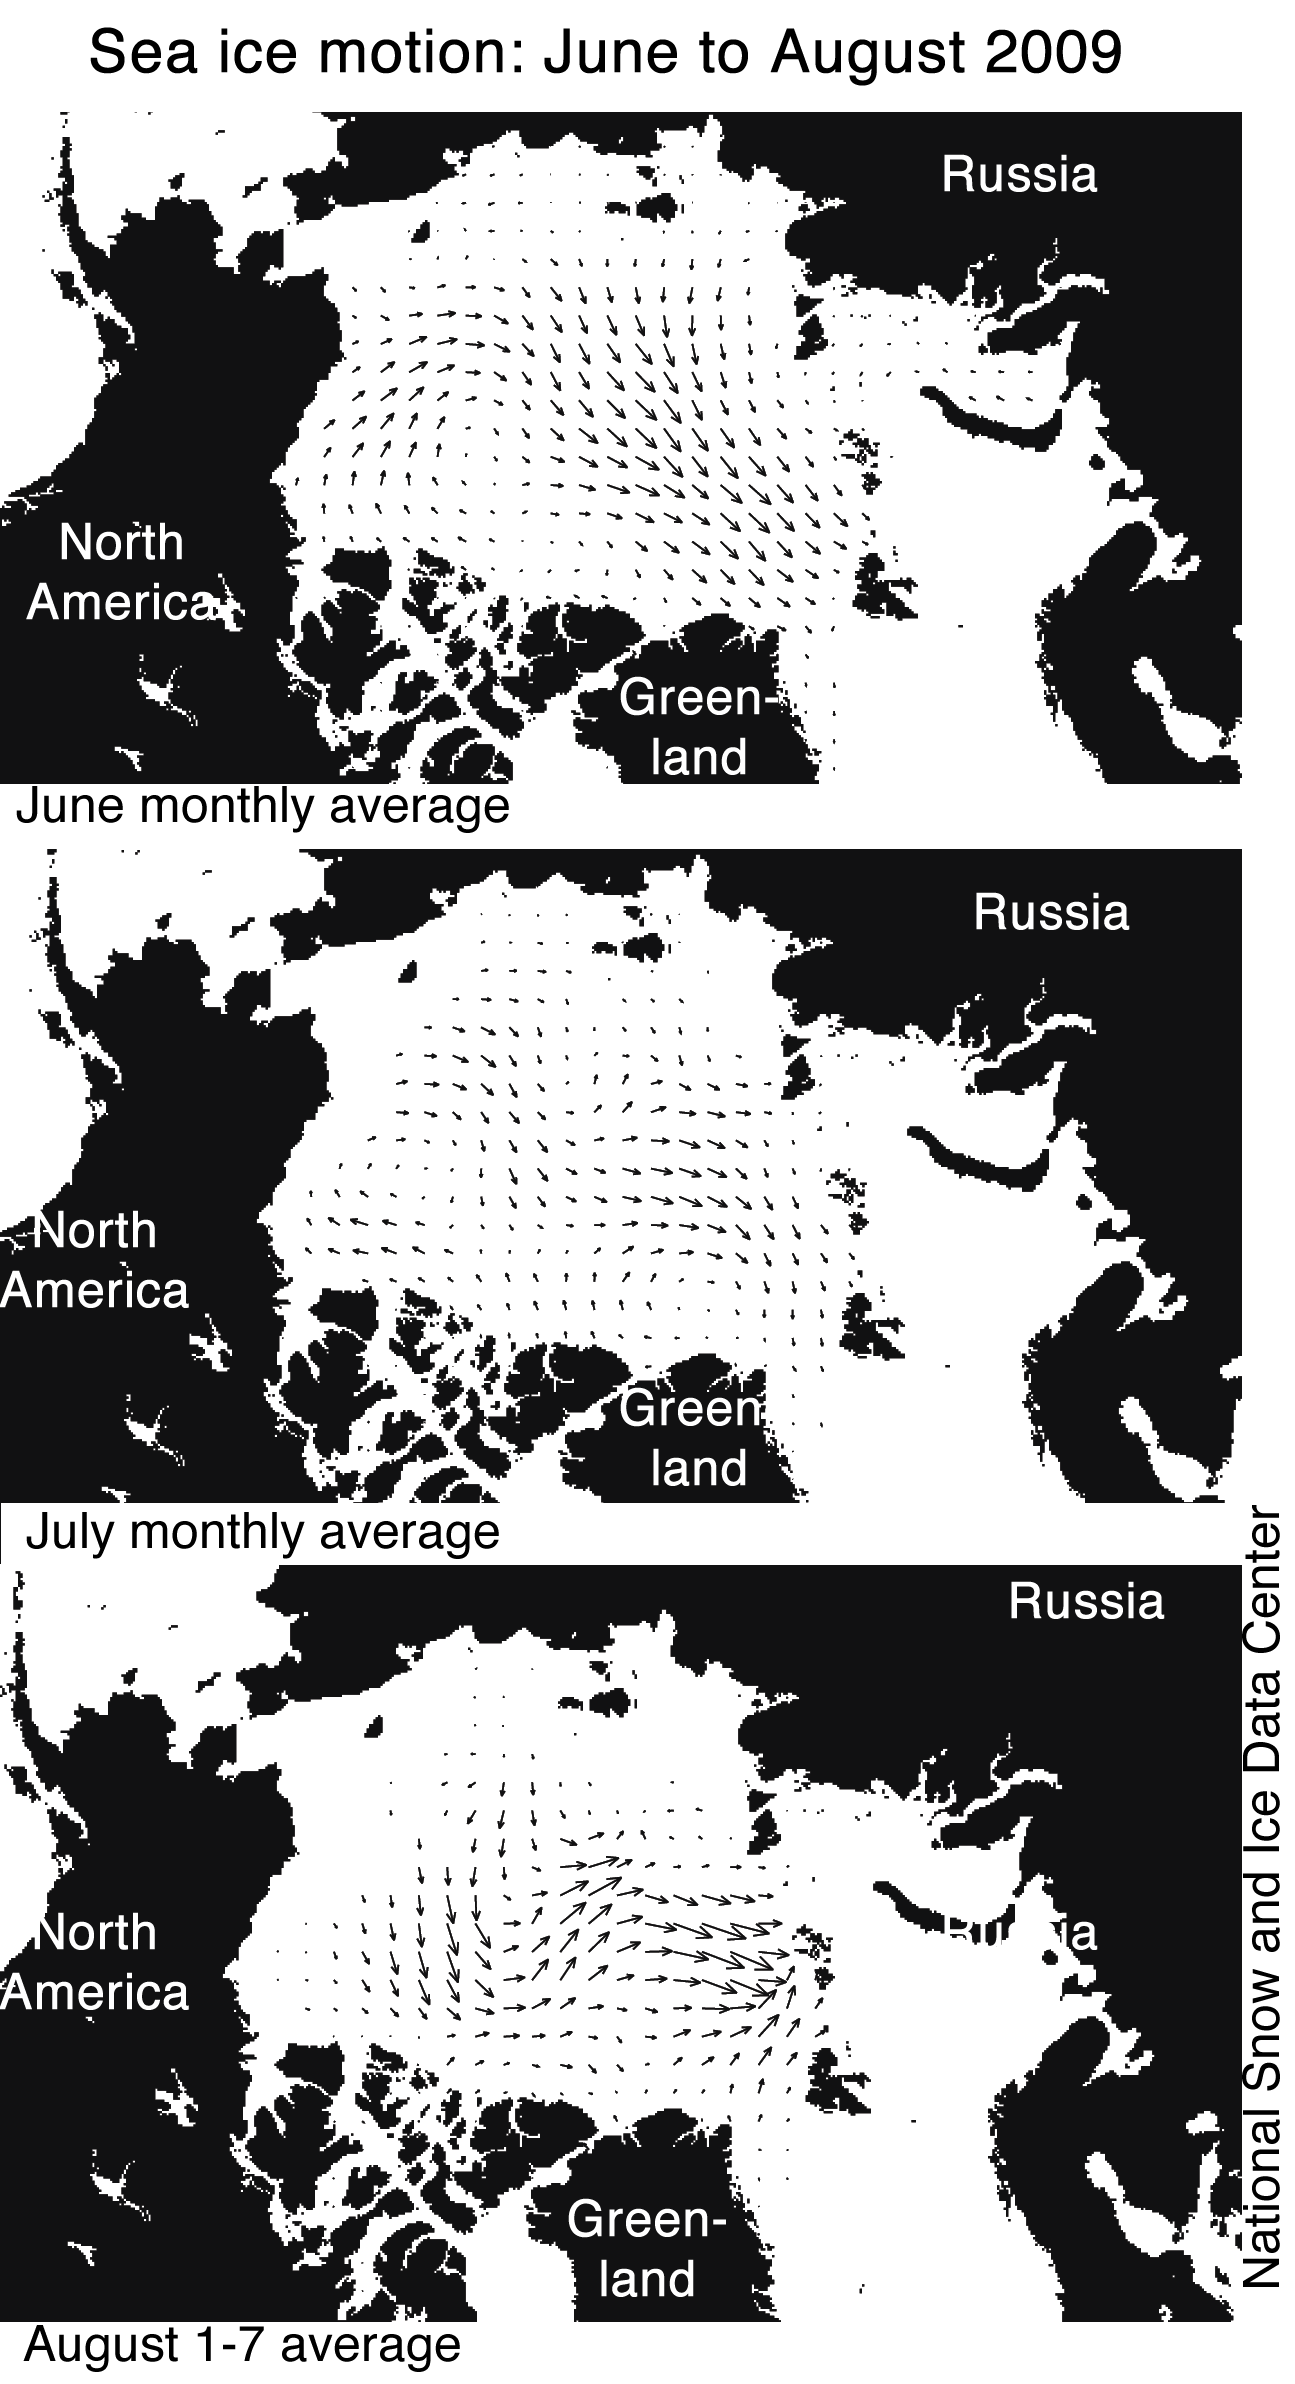
average monthly data from 1979-2009 for July Figure 3. Sea ice motion, derived from AMSR-E data and averaged for June, July, and the first week of August 2009 (the most recent data available), shows a recent change, with ice motion towards the eastern Siberian coast and little export of ice out of the Arctic Ocean via Fram Strait. —Credit: National Snow and Ice Data Center. High-resolution image

Ice motion changes in August

A recent atmospheric circulation pattern, which led to a change in ice motion, caused the ice loss rate to slow down significantly in the first two weeks of August. As discussed in the August 4 post, during much of June and July, a strong Beaufort Sea high-pressure pattern promoted winds that helped push ice out of the Siberian coastal seas, and also brought clear skies and warm temperatures that helped induce melt.

Toward the end of July, the atmospheric pattern changed. Averaged over the past two weeks, a high-pressure system has been centered over the Barents Sea, with low pressure centered over the Laptev Sea. In accordance with Buys Ballot's Law, this pattern led to winds that redirected the motion of the ice cover, pushing the ice edge outward toward the Siberian coast and discouraging ice from exiting the Arctic Ocean through Fram Strait.

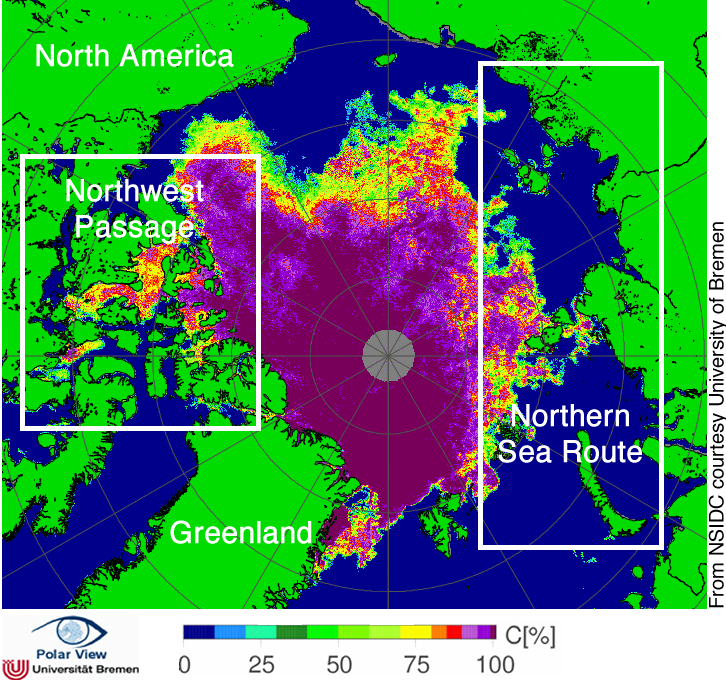
map of arctic showing sea level pressure and atmospheric circulation patterns Figure 4. The map of sea ice concentration from AMSR-E from August 16, 2009, shows ice clogging many of the channels of the Canadian Archipelago. The Northern Sea Route may be clear in the next few weeks. NASA AMSR-E data. —Credit: From National Snow and Ice Data Center, courtesy IUP, University of Bremen, Germany. High-resolution image

The Northwest Passage and Northern Sea Route

So far this year, neither the Northwest Passage nor the Northern Sea Route has opened. The Northern Sea Route appears likely to open soon, but ice still clogs many of the channels in the Northwest Passage.

Whether or not the navigational passages through the Arctic Ocean will open in a given summer depends on atmospheric circulation and ice thickness. For example, although 2007 was a record low extent in the Arctic and the Northwest Passage was nearly completely open, the Northern Sea Route was still choked with ice because of a circulation pattern that pushed a tongue of ice against the Siberian coast. Recent research by Stephen Howell at the University of Waterloo in Canada shows that whether the Northwest Passage clears depends less on how much melt occurs, and more on whether multi-year sea ice is pushed into the channels. Counterintuitively, as the ice cover thins, ice may flow more easily into the channels, preventing the Northwest Passage from regularly opening in coming decades.

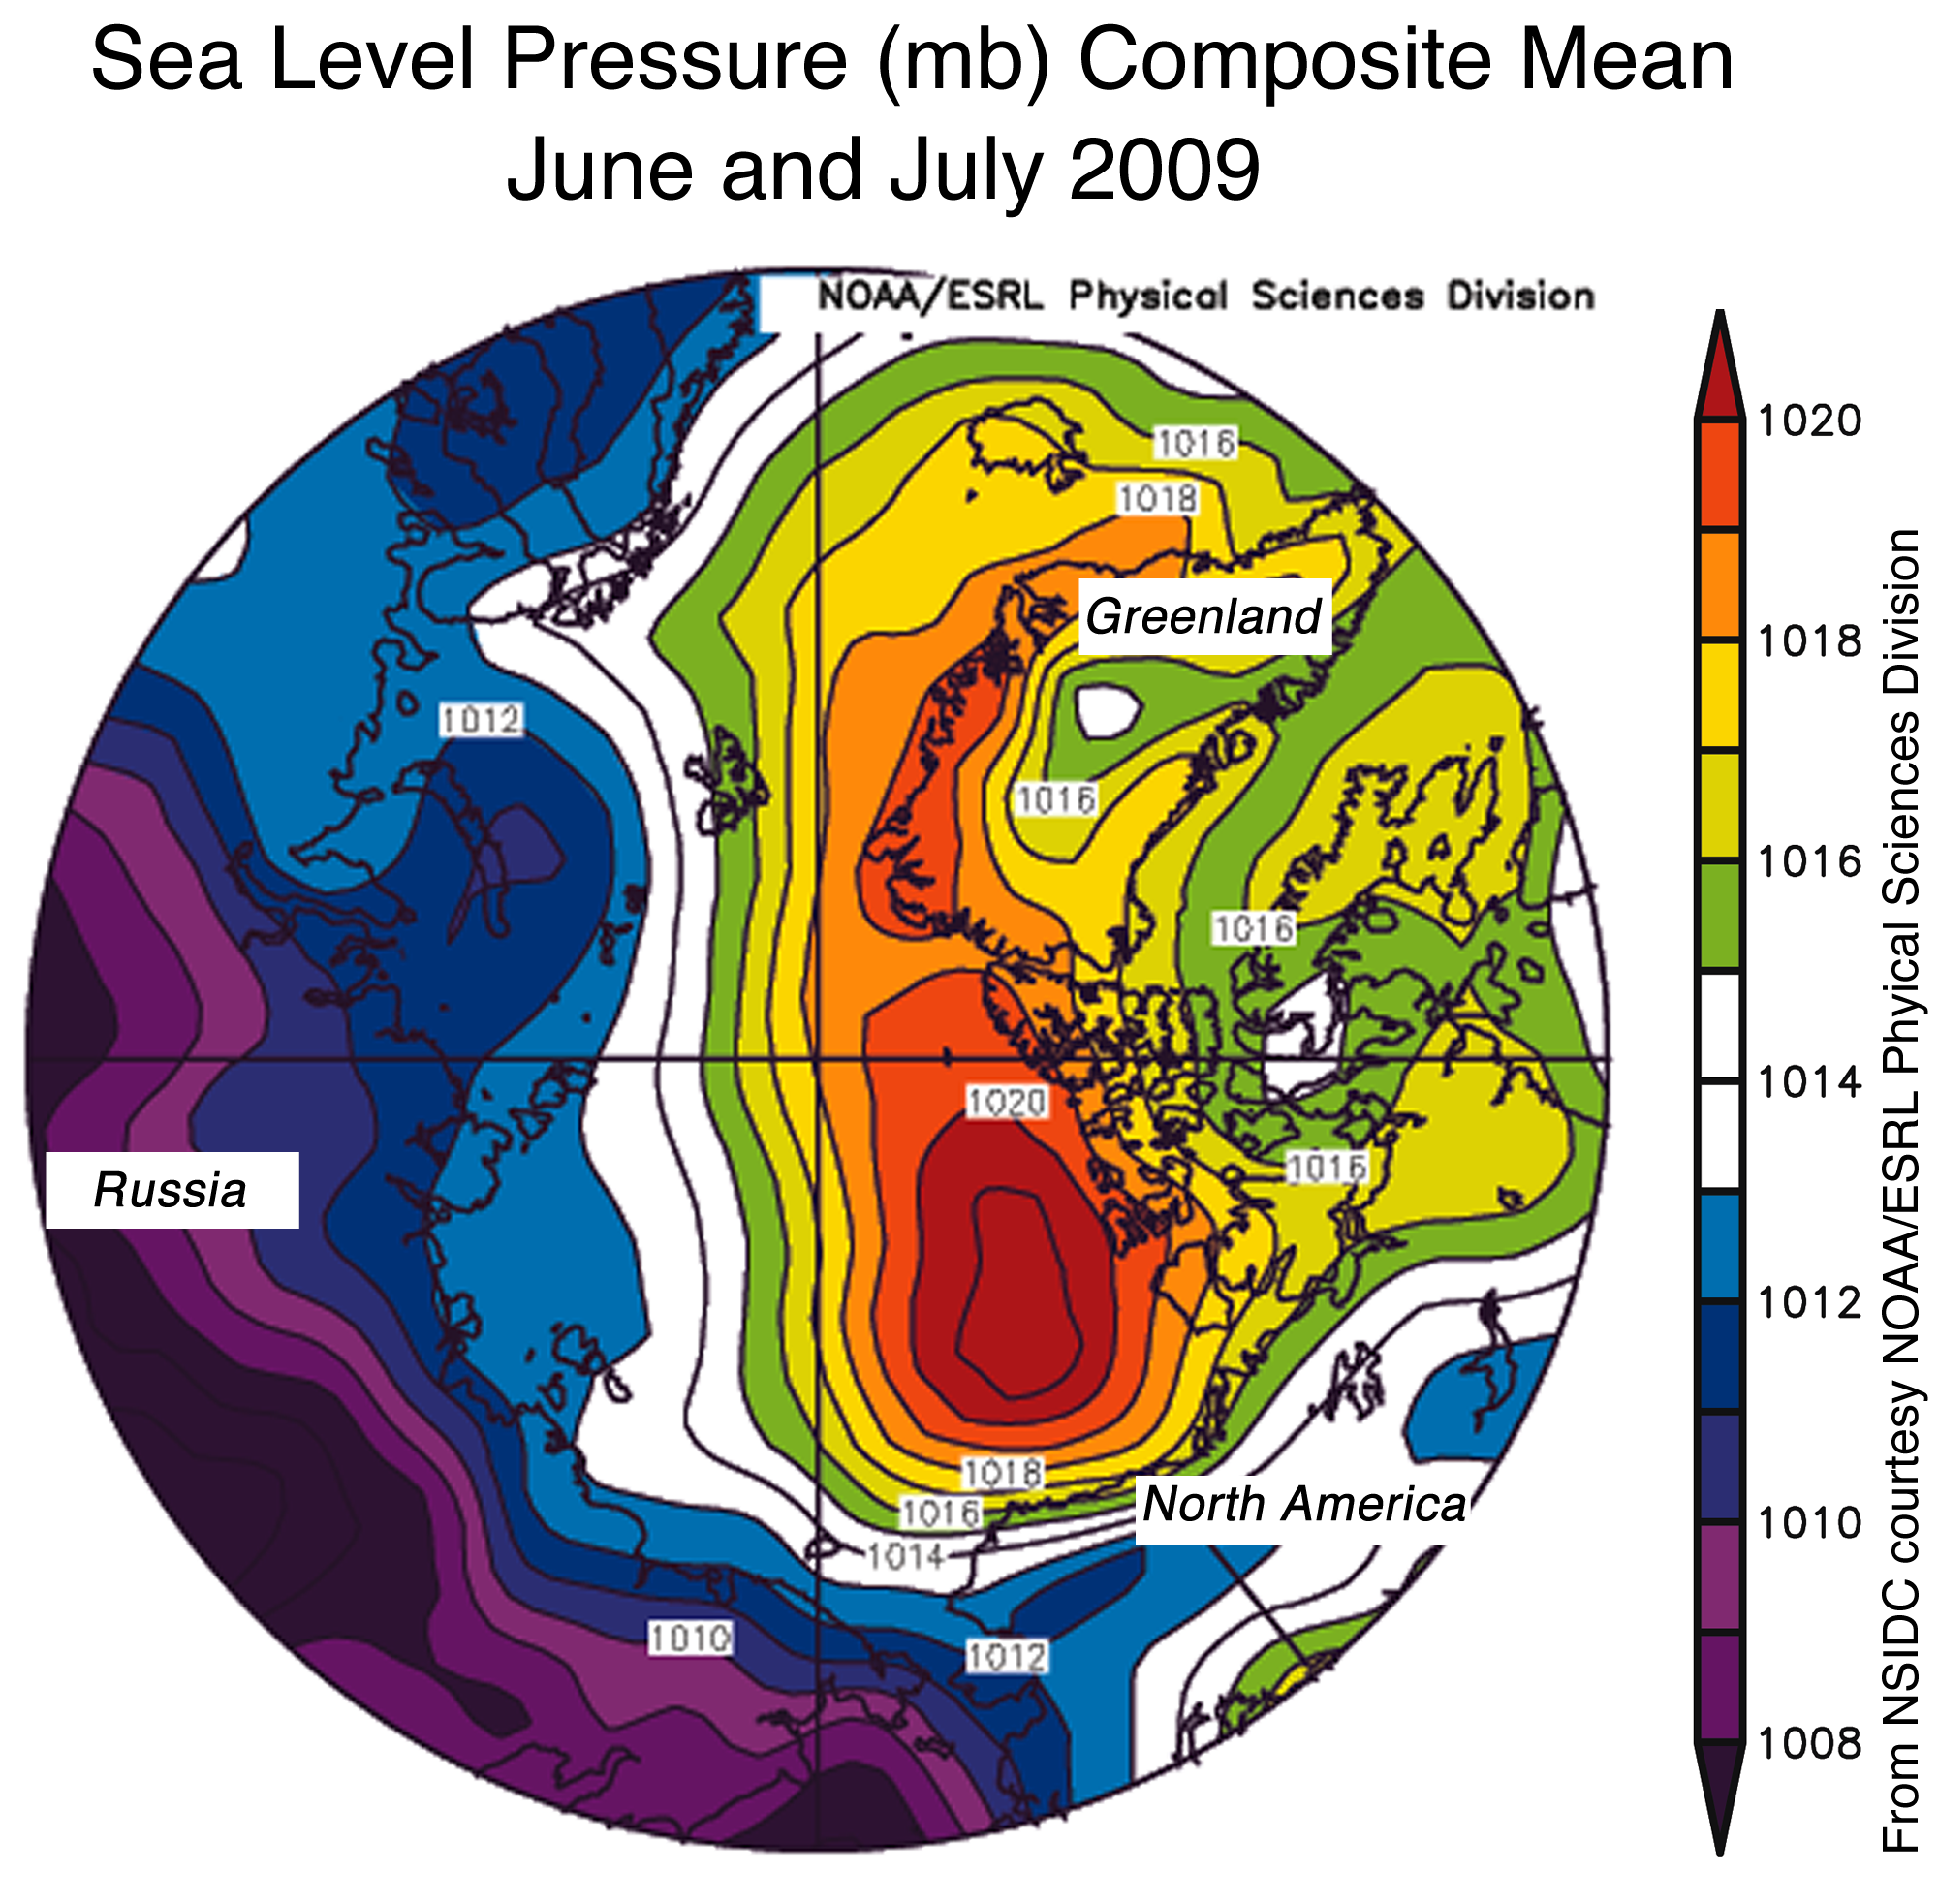
ice thickness from submarinesFigure 4. The map of sea level pressure (in millibars) from June and July 2009 shows a strong high-pressure cell over the Beaufort Sea, similar to the pattern in 2007. In the past, such patterns were rare. —Credit: From National Snow and Ice Data Center, courtesy NOAA/ESRL Physical Sciences Division. High-resolution image

Comment on atmospheric circulation patterns

James Overland of the NOAA Pacific Marine Environmental Laboratory in Seattle, Washington, has taken a close look at patterns of atmospheric circulation in recent summers. Overland notes that the periods June through August 2007 and June and July 2009 both saw an unusual atmospheric pattern of sea level pressure, with higher pressure on the Alaskan side of the Arctic and lower pressure on the Eurasian side. This pressure difference brought warm air into the central Arctic and transported sea ice towards the Atlantic. Historically, such a pattern is a rare event—before 2007, it only occurred twice in 30 years. Normally, there is little difference in pressure across the Arctic during summer, and winds are slack.

This rare condition may result from the convergence of the three main patterns of climate variability: the Arctic Oscillation (AO) climate pattern, which features either high or low pressure over most of the Arctic; the positive phase of the Pacific North American (PNA) pattern, which is characterized by low pressure over the Bering Sea and high pressure over the Canadian Rockies; and the Arctic dipole pattern, which features high pressure on one side of the Arctic and low pressure on the other. In 2007 and 2009 all three patterns have been in play. A clue to the cause of these unusual conditions comes from the wind flow in the middle atmosphere. Normally winds flow in a counter-clockwise direction around the central Arctic Ocean, a flow known as the polar vortex. In the summers of 2007 and 2009 the polar vortex shifted to mostly to the Eurasian side of the Arctic, allowing higher pressures to develop on the Alaskan side. Scientists are now studying whether this dipole pattern will become more common in the future and whether the loss of summer sea ice itself is helping to make this pattern more frequent.

References

Howell, S. E. L., C. R. Duguay, & T. Markus. 2009. Sea ice conditions and melt season duration variability within the Canadian Arctic Archipelago: 1979–2008, Geophys. Res. Lett., 36, L10502; doi: 10.1029/2009GL037681.

Overland, J. E., & M. Wang. 2005. The third Arctic climate pattern: 1930s and early 2000s. Geophys. Res. Lett., 32(23), L23808; doi: 10.1029/2005GL024254.

Wang, M., N. A. Bond, & J. E. Overland. 2007. Comparison of atmospheric forcing in four sub-arctic seas. Deep-Sea Research II, 54, 2543-2559; doi: 10.1016/j.dsr2.2007.08.014

M.M. Fauria et al., Climate Dynamics, Unprecedented low twentieth century winter sea ice extent in the Western Nordic Seas since A.D. 1200

Climate Dynamics (June 23, 2009); DOI: 10.1007/s00382-009-0610-z

M. Macias Fauria1, 2, 5, 10 Contact Information, A. Grinsted4, 3, S. Helama2, J. Moore3, 6, 7, M. Timonen5, T. Martma9, E. Isaksson8 and M. Eronen2

(1) Biogeoscience Institute, University of Calgary, Calgary, AB, Canada
(2) Department of Geology, University of Helsinki, Helsinki, Finland
(3) Arctic Centre, University of Lapland, Rovaniemi, Finland
(4) Centre for Ice and Climate, Niels Bohr Institute, University of Copenhagen, Copenhagen, Denmark
(5) Rovaniemi Research Station, Finnish Forest Institute, Rovaniemi, Finland
(6) Thule Institute, University of Oulu, Oulu, Finland
(7) College of Global Change and Earth System Science, Beijing Normal University, Beijing, China
(8) Polar Environmental Centre, Norwegian Polar Institute, Tromsø, Norway
(9) Institute of Geology, Tallinn University of Technology, Tallinn, Estonia
(10) Department of Ecology, Faculty of Biology, University of Barcelona, Av. Diagonal 645, 08028 Barcelona, Spain

(Received 1 October 2008, accepted 9 June 2009, published online 23 June 2009.)

Abstract

We reconstructed decadal to centennial variability of maximum sea ice extent in the Western Nordic Seas for A.D. 1200–1997 using a combination of a regional tree-ring chronology from the timberline area in Fennoscandia and δ18O from the Lomonosovfonna ice core in Svalbard. The reconstruction successfully explained 59% of the variance in sea ice extent based on the calibration period 1864–1997. The significance of the reconstruction statistics (reduction of error, coefficient of efficiency) is computed for the first time against a realistic noise background. The twentieth century sustained the lowest sea ice extent values since A.D. 1200: low sea ice extent also occurred before (mid-seventeenth and mid-eighteenth centuries, early fifteenth and late thirteenth centuries), but these periods were in no case as persistent as in the twentieth century. Largest sea ice extent values occurred from the seventeenth to the nineteenth centuries, during the Little Ice Age (LIA), with relatively smaller sea ice-covered area during the sixteenth century. Moderate sea ice extent occurred during thirteenth–fifteenth centuries. Reconstructed sea ice extent variability is dominated by decadal oscillations, frequently associated with decadal components of the North Atlantic Oscillation/Arctic Oscillation (NAO/AO), and multi-decadal lower frequency oscillations operating at ~50–120 year. Sea ice extent and NAO showed a non-stationary relationship during the observational period. The present low sea ice extent is unique over the last 800 years, and results from a decline started in late-nineteenth century after the LIA.

M. Macias Fauria, e-mail: mmaciasf@ucalgary.ca

Link to abstract: http://www.springerlink.com/content/922v30um17650817/

P. Rampal, J. Weiss, D. Marsan, J. Geophys. Res., 114, Positive trend in the mean speed and deformation rate of Arctic sea ice, 1979–2007

Journal of Geophysical Research, 114, C05013; doi: 10.1029/2008JC005066.

Positive trend in the mean speed and deformation rate of Arctic sea ice, 1979–2007

P. Rampal (Laboratoire de Glaciologie et Géophysique de l'Environnement, UMR5183, Université Joseph Fourier, CNRS, Saint Martin d'Hères, and Laboratoire de Géophysique Interne et Tectonophysique, UMR5559, Université de Savoie, CNRS, Le Bourget du Lac, France), J. Weiss (Laboratoire de Glaciologie et Géophysique de l'Environnement, UMR5183, Université Joseph Fourier, CNRS, Saint Martin d'Hères, France), and D. Marsan (Laboratoire de Géophysique Interne et Tectonophysique, UMR5559, Université de Savoie, CNRS, Le Bourget du Lac, France)

(Received 1 August 2008, accepted 11 March 2009, published 14 May 2009.)

Abstract

Using buoy data from the International Arctic Buoy Program, we found that the sea ice mean speed has substantially increased over the last 29 years (+17% per decade for winter and +8.5% for summer). A strong seasonal dependence of the mean speed is also revealed, with a maximum in October and a minimum in April. The sea ice mean strain rate also increased significantly over the period (+51% per decade for winter and +52% for summer). We check that these increases in both sea ice mean speed and deformation rate are unlikely to be consequences of a stronger atmospheric forcing. Instead, they suggest that sea ice kinematics play a fundamental role in the albedo feedback loop and sea ice decline: increasing deformation means stronger fracturing, hence more lead opening, and therefore a decreasing albedo. This accelerates sea ice thinning in summer and delays refreezing in early winter, therefore decreasing the mechanical strength of the cover and allowing even more fracturing, larger drifting speed and deformation, and possibly a faster export of sea ice through the Fram Strait. The September minimum sea ice extent of 2007 might be a good illustration of this interplay between sea ice deformation and sea ice shrinking, as we found that for both winter 2007 and summer 2007 exceptionally large deformation rates affected the Arctic sea ice cover.

Rampal, P., Weiss, J. & Marsan, D. (2009). Positive trend in the mean speed and deformation rate of Arctic sea ice, 1979–2007, Journal of Geophysical Research, 114, C05013; doi: 10.1029/2008JC005066.

Link to abstract: http://www.agu.org/pubs/crossref/2009/2008JC005066.shtml

P. Rampal, J. Weiss, & D. Marsan: New insight into decline of Arctic Sea ice cover

Dear Readers,

I can't help but add my own snarky comment about the results of this research. Last year, it was all too obvious (to me) from my daily, nay hourly, perusal of the satellite images from the Arctic that the multi-year sea ice had all but left the Arctic Ocean. Now, the British investigators have returned from their trek to the North Pole and have reported that they didn't find any multi-year ice on their route! I am commenting now about this because last year I wrote in a realclimate thread on the sea ice that the multi-year was all but gone because it had moved out between Greenland and Svalbard, and I was told (not by the realclimate people) that this was impossible because the sea ice does not move that fast. So, here it is, my snarky comment, sorry. [Do I need to also mention that during 2007, watching the water vapor satellite photo 24-hour animations I could see large hurricane and typhoon systems being sucked up to the Arctic? I went on and on about this in various threads, with no support from the illuminati. Now, papers are being published, which show that this occurred and that the resulting energy and heat entered the Arctic Ocean, as I had seen (I mean, really, this is not rocket science -- huge hot storms go up to the Arctic for months on end -- what else is to be expected except melting sea ice, come on!]

New insight into decline of Arctic Sea ice cover

ScienceDaily (May 15, 2009) — The mechanical behavior of the Arctic sea ice cover appears to favor its rapid decline. Scientists from INSU-CNRS, Université J. Fourier and Université de Savoie have analyzed the trajectories of drifting buoys anchored in the ice and found that the mean drift rate and deformation rate of Arctic sea ice has strongly increased over the last three decades. These effects, related to the mechanical properties of the cover, contribute to the faster-than-expected decline of Arctic sea ice.

This work is published in the 14 may 2009 issue of the Journal of Geophysical Research – Oceans.

Scientists from the Laboratoire de Glaciologie et Géophysique de l’Environnement of Grenoble (CNRS/Université J. Fourier) and the Laboratoire de Géophysique Interne et Tectonophysique of Chambéry (CNRS-Université J. Fourier-Université de Savoie), inspired by the 2006-2007 expedition of the polar schooner Tara, which drifted along the transpolar drift more than twice as fast as Nansen’s Fram ship 115 years earlier, analyzed the trajectories of more than 600 buoys anchored into the ice over the last 30 years1. They observed a substantial increase in the mean drift rate of the sea ice, equivalent to +10% per decade. Looking at the dispersion rate of the buoys, they also measured a strong increase in the mean deformation rate of the sea ice, equivalent to +50% in both winter and summer. This combined acceleration of Arctic sea ice drift and deformation appears to be related to, and would actually strengthen, the thinning of the cover.

A close link between sea ice deformation and fracturing had previously been revealed by scientists from LGGE(2). Increased deformation leads to greater fracturing, which in turn leads to Arctic ocean warming through solar radiation in summer. This process accelerates sea ice thinning in summer and delays refreezing in early winter, decreasing the mechanical strength of the cover and leading to even more fracturing and greater drift speed and deformation. In addition, a more fractured, and hence more mobile, sea ice cover will be exported at a faster rate out of the Arctic towards the Atlantic. These two effects, combined with the mechanical properties of the sea ice cover,probably participate to the general decline of the Arctic sea cover.

The spectacular, and largely unexpected, sea ice shrinkage observed in the summer of 2007 might be a good illustration of the interplay between sea ice deformation and decline, as the exceptional deformation rates measured by scientists in the winter of 2006-2007 most likely contributed to the levels of deformation measured the following summer and therefore to the observed shrinkage.

These complex processes and interactions, which are difficult to model in climate simulations, might partly explain why scientists have been unable to calculate the rate of decline of the Arctic sea ice cover.

1Dataset from the International Arctic Buoy Program (http://iabp.apl.washington.edu/). These buoys were originally launched to record sea level pressures and air temperatures over the Arctic.

  1. Rampal, P., Weiss, J. & Marsan, D. 2009. Positive trend in the mean speed and deformation rate of Arctic sea ice, 1979–2007. Journal of Geophysical Research, 114 (C5), C05013; DOI: 10.1029/2008JC005066
  2. Weiss, J., Schulson, E. M., & Stern, H. L. 2007. Sea ice rheology from in-situ, satellite and laboratory observations: Fracture and friction. Earth and Planetary Science Letters, 255 (1-2), 1; DOI: 10.1016/j.epsl.2006.11.033

Catherine Brahic: Early springs show Siberia is warming fast

Early springs show Siberia is warming fast

by Catherine Brahic, New Scientist, August 1, 2007

Siberia is experiencing earlier springs, a study of satellite images has revealed. The trend is likely to be triggering more forest fires, say researchers, and to be linked to global warming.

In a study of a wide range of Siberian ecosystems, Heiko Baltzer of the University of Leicester, UK, and his colleagues found that from 1982 to 1999 spring began and peaked increasingly earlier for almost all the ecosystems.

The advance was greatest in urban environments, where the start of the growing season advanced by an average of 0.7 days per year -- a total of 12.6 days over the 18 years. The advance was also significant in non-evergreen broadleaf forests -- an average of 0.5 days every year.

The growing season is starting earlier because of warmer temperatures, which are causing the snow to melt earlier. "Global warming in Siberia is happening faster than the global average," says Baltzer. "This has been documented by the UN's Intergovernmental Panel on Climate Change."

Fuelling wildfires

Baltzer believes the early onset of spring is causing more and more forest fires in Siberia. "During the 19th century, a typical forest in Siberia had about 100 years after a fire to recover before it burned again. But new observations by Vjatcheslav Kharuk at the Russian Academy of Sciences have shown that fires now return more frequently -- about every 65 years during the 20th century," says Baltzer.

He says that a consequence of the snow melting earlier in the year -- triggering the start of the growing season -- is that the soil tends to be drier later on in the year. This effect has been shown to help fuel wildfires in the Rocky Mountains in the US in a 2006 study led by Anthony Westerling of Scripps Institution of Oceanography in California, US (Science, vol 313, p 888).

Baltzer found that early springs in Siberia were linked to the Arctic Oscillation, an atmospheric phenomenon similar to the El Niño Southern Oscillation in the Pacific Ocean.

He and his colleagues had previously shown that forest fires in Siberia were similarly linked to this phenomenon. His latest research suggests that years of high Arctic Oscillation activity tend to be characterised by early springs, as well high forest fire activity.

Swirling vortex

The Arctic Oscillation governs how fast storms circle around the North Pole, but Baltzer cautions that this is simply a correlation -- the vortex does not necessarily cause the fires and the snowmelt.

"What is likely is that the Arctic Oscillation Index is an indicator of large scale climate change," he told New Scientist. "Imagine molecules in a bottle. As the bottle heats up, the molecules move faster."

In November 2006, a team led by James Randerson of the University of California at Irvine in the US showed that forest fires in high latitudes tend to cool the local climate in the long-term.

But Baltzer says this does not necessarily mean Siberia will undergo a negative feedback loop, where global warming will cause forest fires which will in turn result in cooling, and return the ecosystem to normal. He cautions that such reasoning does not take into account the other effects of global warming on forests. For instance, modelling studies have suggested that forests will move towards the poles as a result of climate change.

Journal reference: Journal of Climate (DOI:10.1175/JCLI4226).

Link to article: http://www.newscientist.com/article/dn12394-early-springs-show-siberia-is-warming-fast.html

Arctic sea ice thinnest ever going into spring by Seth Borenstein

Arctic sea ice thinnest ever going into spring

Carbon tax only way to keep planet cool: Hansen AFP/LAVAL UNIVERSITY/File – This image shows Markham Fiord, in August 2008, after the Markham Ice Shelf broke away. "In the …

WASHINGTON – The Arctic is treading on thinner ice than ever before. Researchers say that as spring begins, more than 90% of the sea ice in the Arctic is only 1 or 2 years old. That makes it thinner and more vulnerable than at anytime in the past three decades, according to researchers with NASA and the National Snow and Ice Data Center in Colorado.

"We're not set up well for summertime," ice data center scientist Walt Meier said Monday. "We're in a very precarious situation."

Young sea ice in the Arctic often melts in the spring and summer. If it survives for two years, then it becomes the type of thick sea ice that is key. But the past two years were warm, and there's more young, thin ice at the top of the world.

In normal winters, thick sea ice — often about 10 feet thick or more — extends from the northern boundaries of Greenland and Canada almost to Russia. This year, the thick ice cap barely penetrates the bull's-eye of the Arctic Circle.

The amount of thick sea ice hit a record wintertime low of just 378,000 square miles this year, down 43% from last year, Meier said. The amount of older sea ice that was lost is larger than the state of Texas.

"That thick ice really traps ocean heat; it keeps the planet in its current state of balance," said Waleed Abdalati, director of the Center for the Study of Earth from Space at the University of Colorado and NASA's former chief ice scientist. "When we start to diminish that, the state of balance is likely to change, tip one way or another."

Sea ice is important because it reflects sunlight away from Earth. The more it melts, the more heat is absorbed by the ocean, heating up the planet even more, said NASA polar regions program manager Tom Wagner. That warming also can change weather patterns worldwide and it alters the ecosystems for animals such as polar bears.

The Arctic essentially acts as a refrigerator for the rest of the globe. And the amount of sea covered by ice — thick or thin — has been shrinking at a rate of about 3% a decade in the Arctic.

This year, the maximum ice cover of 5.85 million square miles — reached on Feb. 28 — was higher than four of the previous five years. But it was still the fifth lowest since record-keeping began in 1979.

Usually, younger, thin ice accounts for about 70% of the ice cover. This year it reached 90%, Meier said.

And the problems of global warming caused melt is being seen at the other pole, too.

The U.S. Geological Survey last week released a detailed map of the Antarctic coastline and found dwindling and even disappearing ice shelves.

The map itself was finished in the middle of last year, but the previous Interior Department didn't want to release it and other Antarctic maps, said map co-author Richard Williams Jr., a glaciologist for the USGS. The report with the map bears the 2008 date and the previous interior secretary's name on it.

The map shows found for the first time that an entire ice shelf — the Wordie ice shelf on the western end of the Antarctic peninsula — has essentially disappeared. In 1966, it was 772 square miles. In addition, about 4,500 square miles of the Larsen ice shelf is gone.

"The map portrays one of the most rapidly changing areas on Earth, and the changes in the map are widely regarded as among the most profound, unambiguous examples of the effects of global warming on Earth," the USGS report concludes.

Link to article: http://news.yahoo.com/s/ap/20090406/ap_on_sc/arctic_ice

Arctic sea ice shrinkage, Arctic amplification, Greenland ice sheet mass trend

from the goose-lane.com blog, March 19, 2009

Arctic sea ice shrinkage


Very substantial decrease in Arctic Sea ice in 2007 from 2005 and also from 1979-2000 average


Greenland Ice Sheet Mass Trend


Arctic Temperature Trend 1987-2007

Arctic shrinkage is the shrinkage of the Arctic region (as marked by isotherms), due to changes in the regional climate. Effects of Arctic shrinkage include melting permafrost, leading to Arctic methane release, a marked decrease in Arctic sea ice and the observed increase in melt on the Greenland Ice Sheet in recent years. Whilst there is a periodic variation in sea-ice extent due to the Arctic oscillation, among other varying factors, there is a long-term negative trend in recent years, attributed to global warming. (It is notable that the Arctic oscillation itself is believed to be affected strongly by global warming.)

The Arctic also stores vast quantities of methane, a potent greenhouse gas in permafrost and clathrates. Arctic methane release is accelerating rapidly due to Arctic shrinkage. This has the potential to create a runaway climate change event, which may have features in common with the Great dying (a mass extinction), and with the Paleocene-Eocene thermal maximum (an abrupt climate change event), although both of these took place in a climate much warmer than today’s. It has also been suggested that there could be a shutdown of thermohaline circulation, similar to that which is believed to have driven the Younger Dryas, an abrupt climate change event. This is now thought unlikely in the near future. There is also potentially a possibility of a more general disruption of ocean circulation, which may lead to an ocean anoxic event, although these are believed to be much more common in the distant past. It is unclear whether the appropriate pre-conditions for such an event exist today.

Computer models predict that the sea ice area will continue to shrink in the future, though there is no consensus on when the Arctic Ocean might become ice-free in summer. Current climate models frequently underestimate the rate of shrinkage. In 2007 the IPCC reported that “the projected reduction is accelerated in the Arctic, where some models project summer sea ice cover to disappear entirely in the high-emission A2 scenario in the latter part of the 21st century.? There is currently no scientific evidence that a seasonally ice-free Arctic Ocean existed anytime in the last 700,000 years, although there were periods when the Arctic was warmer than it is today. Scientists are studying possible causal factors such as direct changes resulting from the greenhouse effect as well as indirect changes such as unusual wind patterns, rising Arctic temperatures, or shifting water circulation (such as increasing inflows of warm, fresh water to the Arctic Ocean from rivers.)

According to the Intergovernmental Panel on Climate Change, “warming in the Arctic, as indicated by daily maximum and minimum temperatures, has been as great as in any other part of the world.” Reduction of the area of Arctic sea ice means less solar energy is reflected back into space, thus accelerating the reduction.

The lowest extent of sea ice was in 2007; that of 2008 was slightly greater The area covered at a particular time is what determines the albedo of the Arctic region and thus has an important effect on future warming (or cooling) trends through ice-albedo feedback.

Sea ice may reach a tipping point and then be lost. The loss of the Arctic sea ice may represent a tipping point in global warming, when ‘runaway’ climate change starts. This is due to the release of methane from permafrost and clathrates in the region, and also because of ice-albedo feedback effects. Recent research, however, has challenged the notion of an imminent Arctic sea ice tipping point.

Several specific Arctic geoengineering schemes have been proposed to reduce Arctic Shrinkage. Further, scientists such as Paul Crutzen have argued for general geoengineering proposals such as using stratospheric sulfur aerosols to be used, which will affect the Arctic if deployed in or near this region.

Link to article: http://goose-lane.com/?p=1382

National Snow and Ice Data Center: Arctic Sea Ice News and Analysis, February 3, 2009: Ice extent continues to track below normal

National Snow and Ice Data Center: Arctic Sea Ice News and Analysis, February 3, 2009: Ice extent continues to track below normal

Sign up for the RSS logo Arctic Sea Ice News RSS feed for automatic notification of analysis updates. Updates are also available via Twitter.

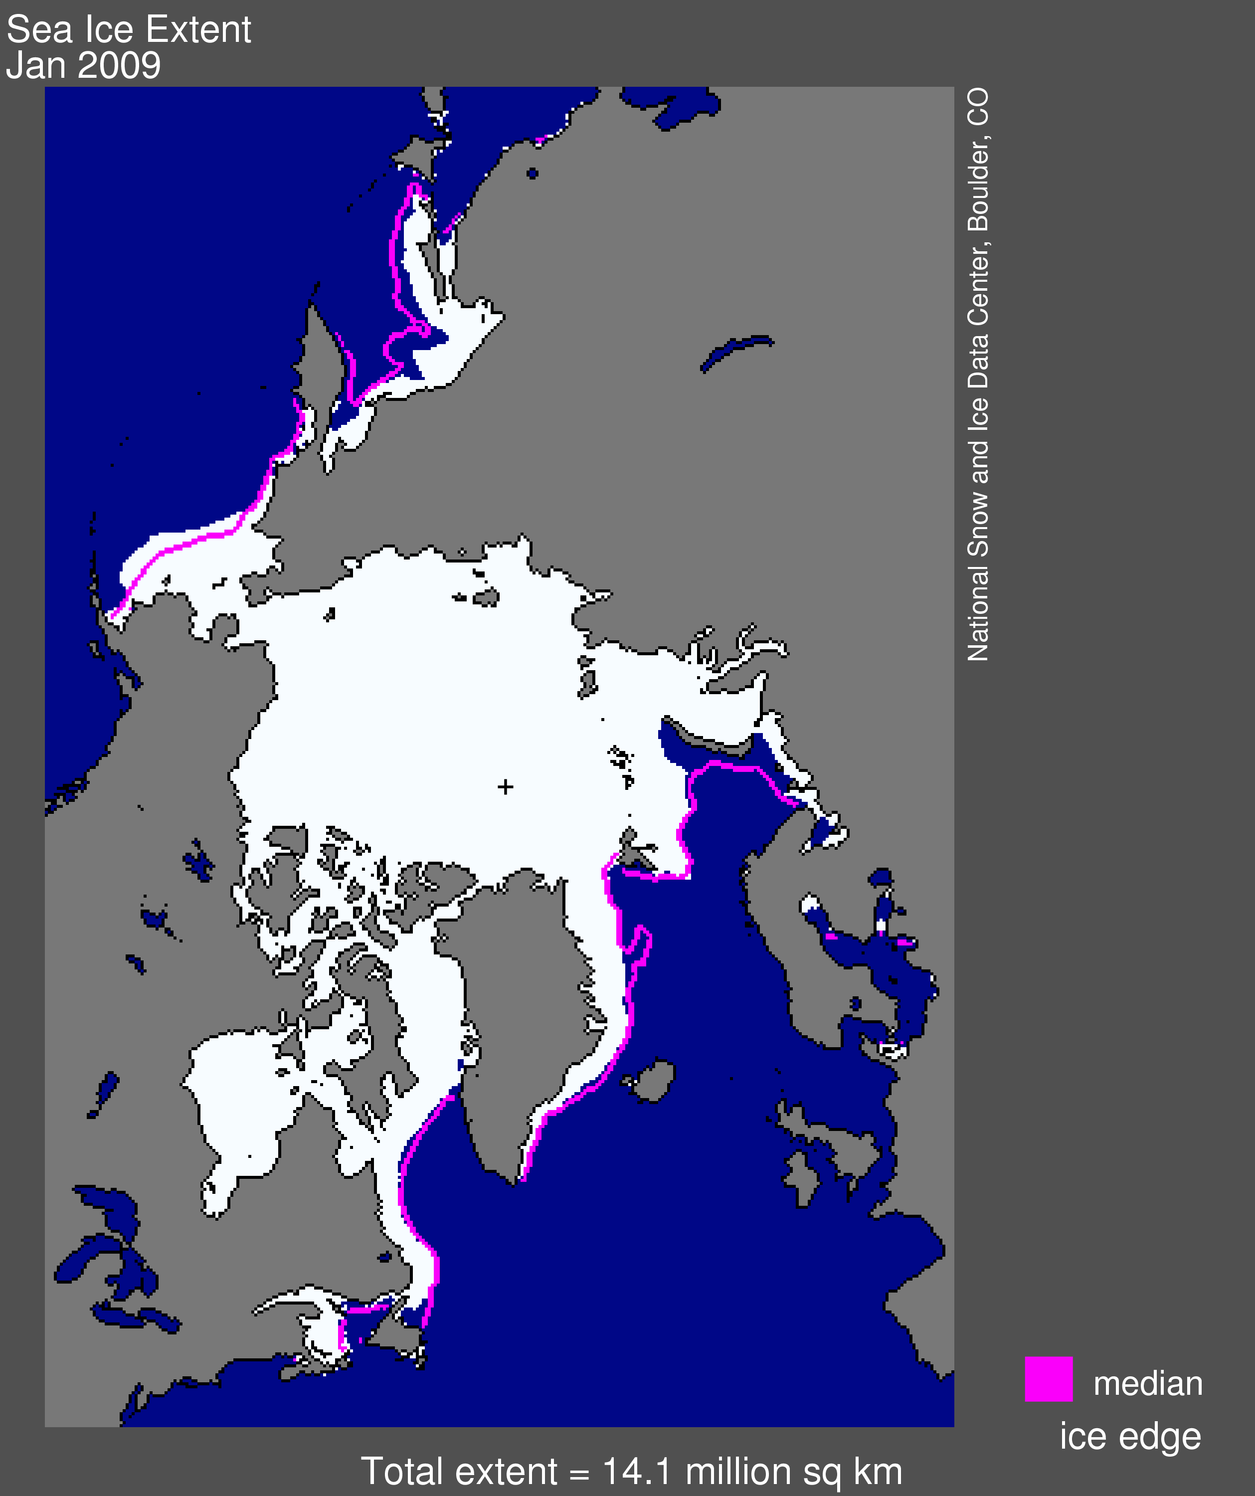
As is typical during mid-winter, sea ice extent increased overall in January; maximum monthly extent is expected in March. However, January ice extent remained well below normal compared to the long-term record. Ice extent averaged for January 2009 is the sixth lowest January in the satellite record. Also of note is that from January 15 to 26, ice extent saw essentially no increase; an unusual wind pattern appears to have been the cause.

Map of sea ice from space, showing sea ice, continents, ocean
Figure 1. Arctic sea ice extent for January 2009 was 14.08 million km² (5.43 million miles²). The magenta line shows the 19792000 median extent for January. The black cross indicates the geographic North Pole. Sea Ice Index data. About the data.
—Credit: National Snow and Ice Data Center

High-resolution image

Overview of conditions

Arctic ice extent averaged for the month of January was 14.08 million km² (5.43 million square miles). January extent was 760,000 km² (293,000 miles²) less than for the 1979 to 2000 average, and 310,000 km² (120,000 miles²) greater than for January 2007.

During the month of January, Arctic sea ice extent increased by 1.12 million km² (440,000 miles²), an average increase of 36,000 km² (13,900 miles²) per day.

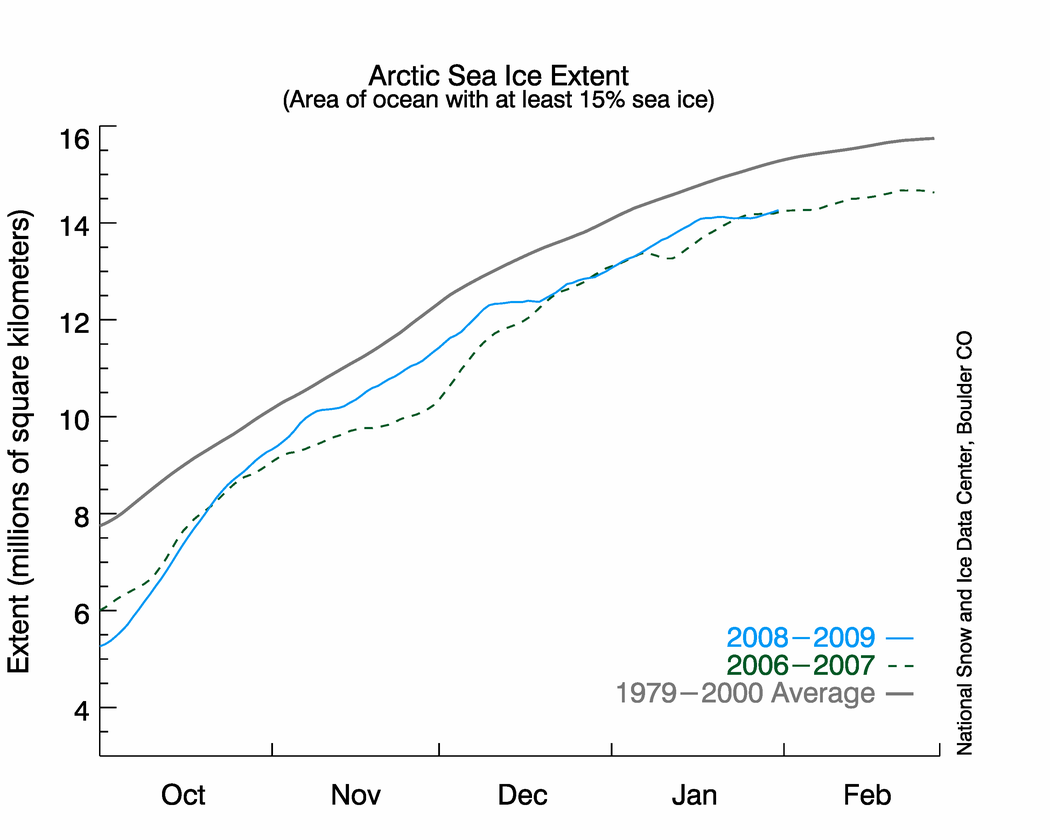
Graph with months on x axis and extent on y axisFigure 2. The graph above shows daily sea ice extent.The solid blue line indicates 2008–2009; the dashed green line shows 2006–2007 (the record-low, summer minimum occurred in 2007); and the solid gray line indicates average extent from 1979 to 2000. Sea Ice Index data. —Credit: National Snow and Ice Data Center

High-resolution image

Conditions in context

While ice extent climbed through the month of January as a whole, the period from January 15 to 26 saw almost no increase in ice extent, appearing as a flattening in the line graph. Extent during this pause remained fairly steady at around 14.0 million square kilometers (5.4 million square miles).

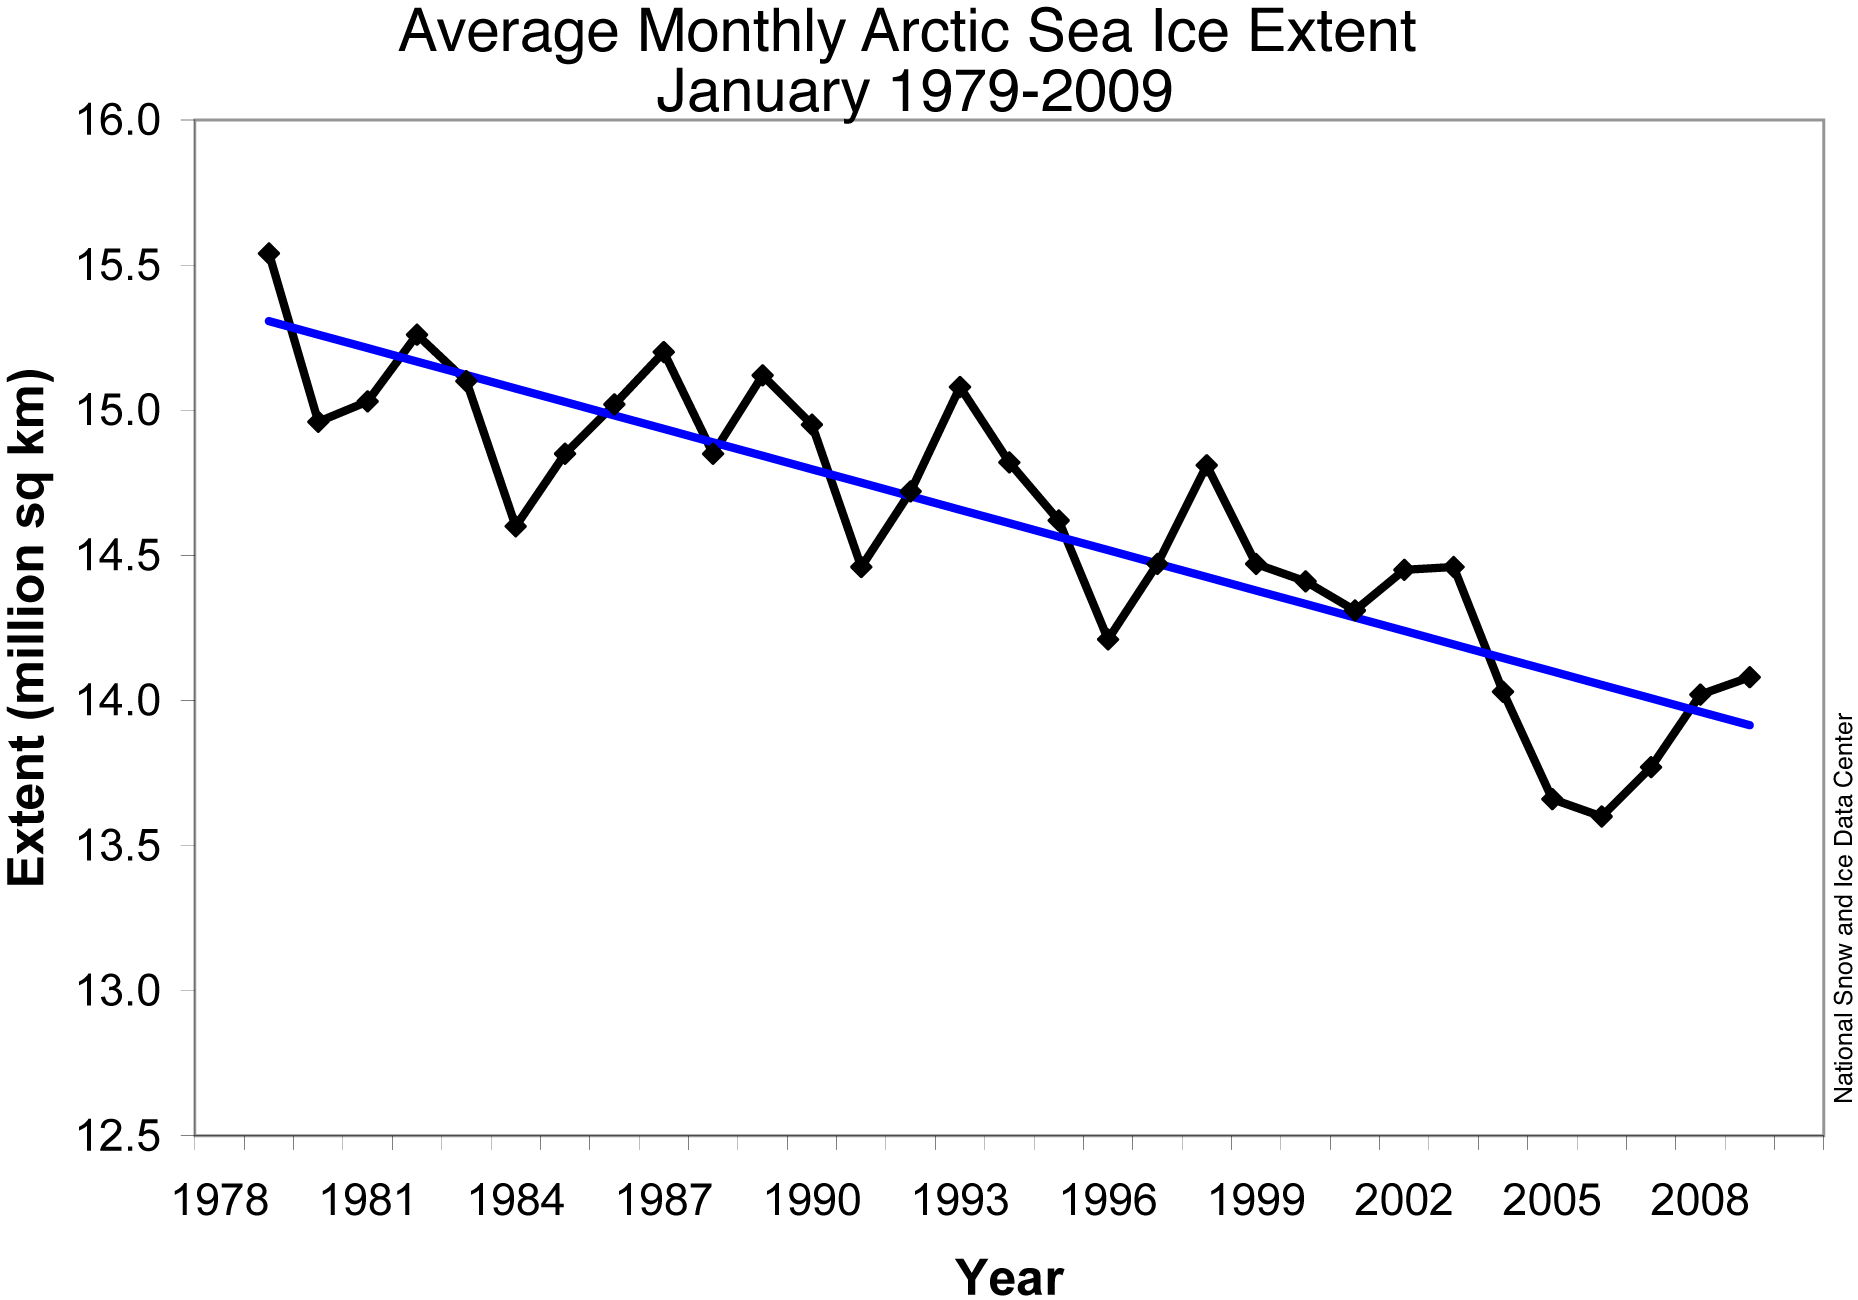
chart showing january extentFigure 3. Monthly January ice extent for 19792009 shows 2009 as the sixth lowest January on record. —Credit: National Snow and Ice Data Center
High-resolution image

January 2009 average extent compared to past Januaries

Average ice extent for January 2009 was the sixth lowest in the satellite record. January 2006 had the lowest ice extent for the month; January 2005 claims second place; and January 2007 is in third place. Including 2009, the downward linear trend in January ice extent stands at 3.1% per decade.

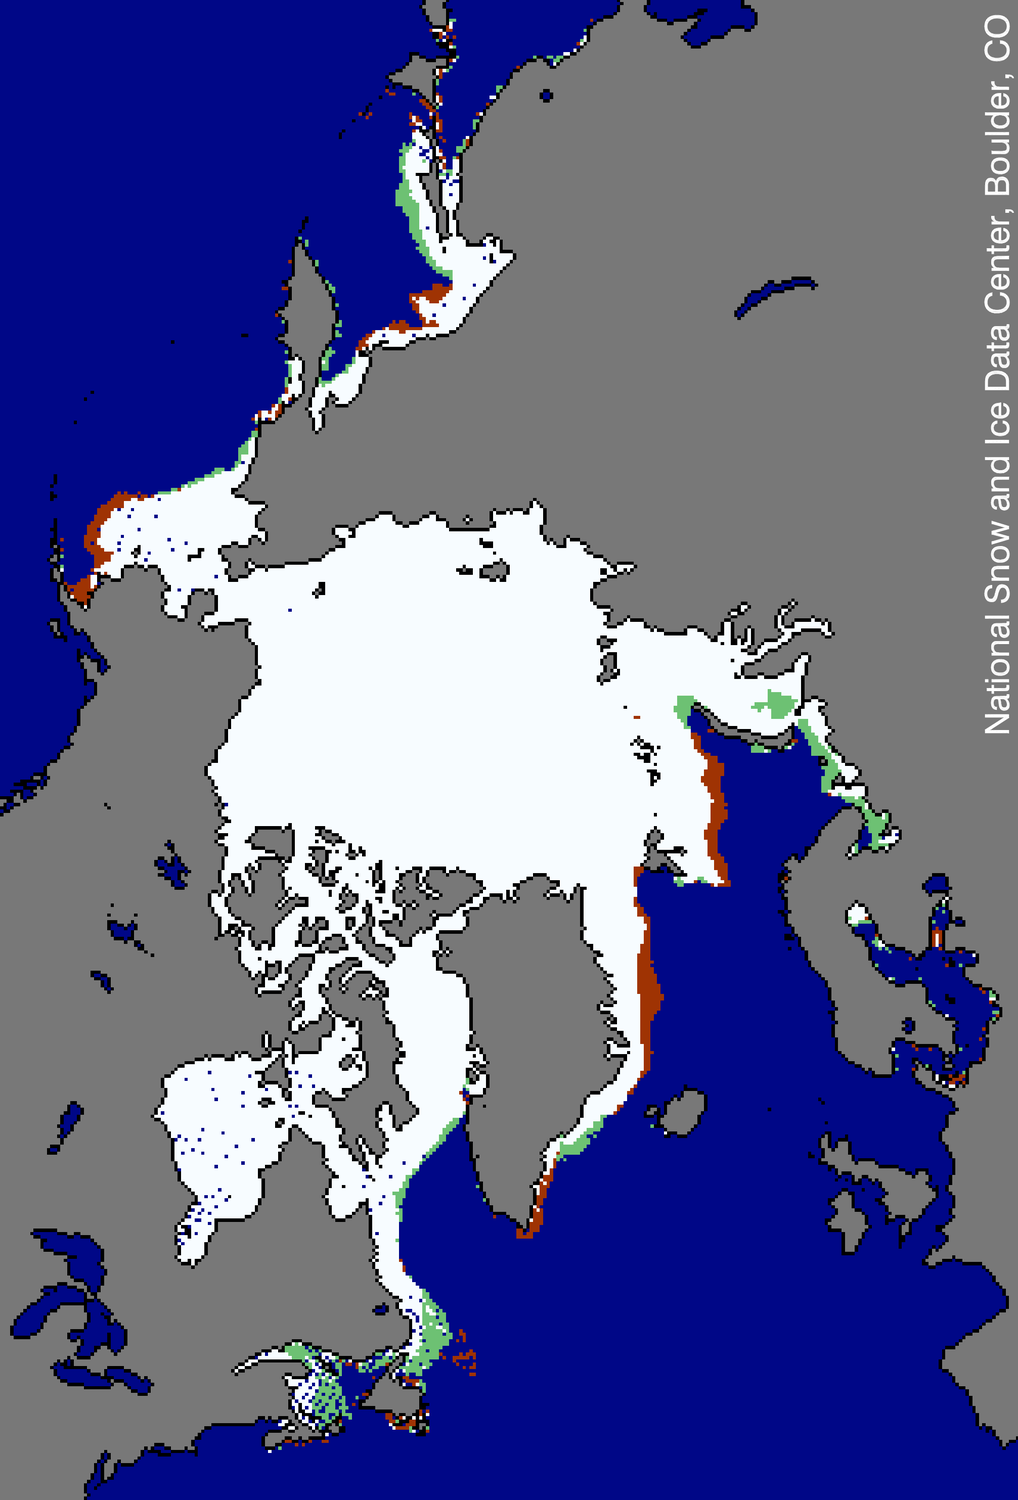
Map showing arctic air temperature anomolies in bright colors Figure 4. This map compares ice extent on January 15 to ice extent on January 26, 2009. Areas in red indicate where ice was present on January 15 but had disappeared by January 26; areas in green indicate where ice was not present on January 15 but had appeared by January 26. Note in particular the regional balance between reduced ice extent in parts of the Arctic and increased extent in others. Sea Ice Index data. —Credit: National Snow and Ice Data Center

High-resolution image

A balancing act of regional growth and decline

The pause in total sea ice extent change from January 15 to 26 reflects expanding and declining ice extent in different areas of the Arctic. For example, ice extent increased southwest of Greenland but decreased in areas east of Greenland and in parts of the Barents Sea.

This regional variability of sea ice extent as seen from satellites gives the bird's-eye view of the changeable conditions on the ground that Arctic residents must deal with. One Arctic community may note increased sea ice extent, while at the same time another community not far away may note decreased sea ice extent.

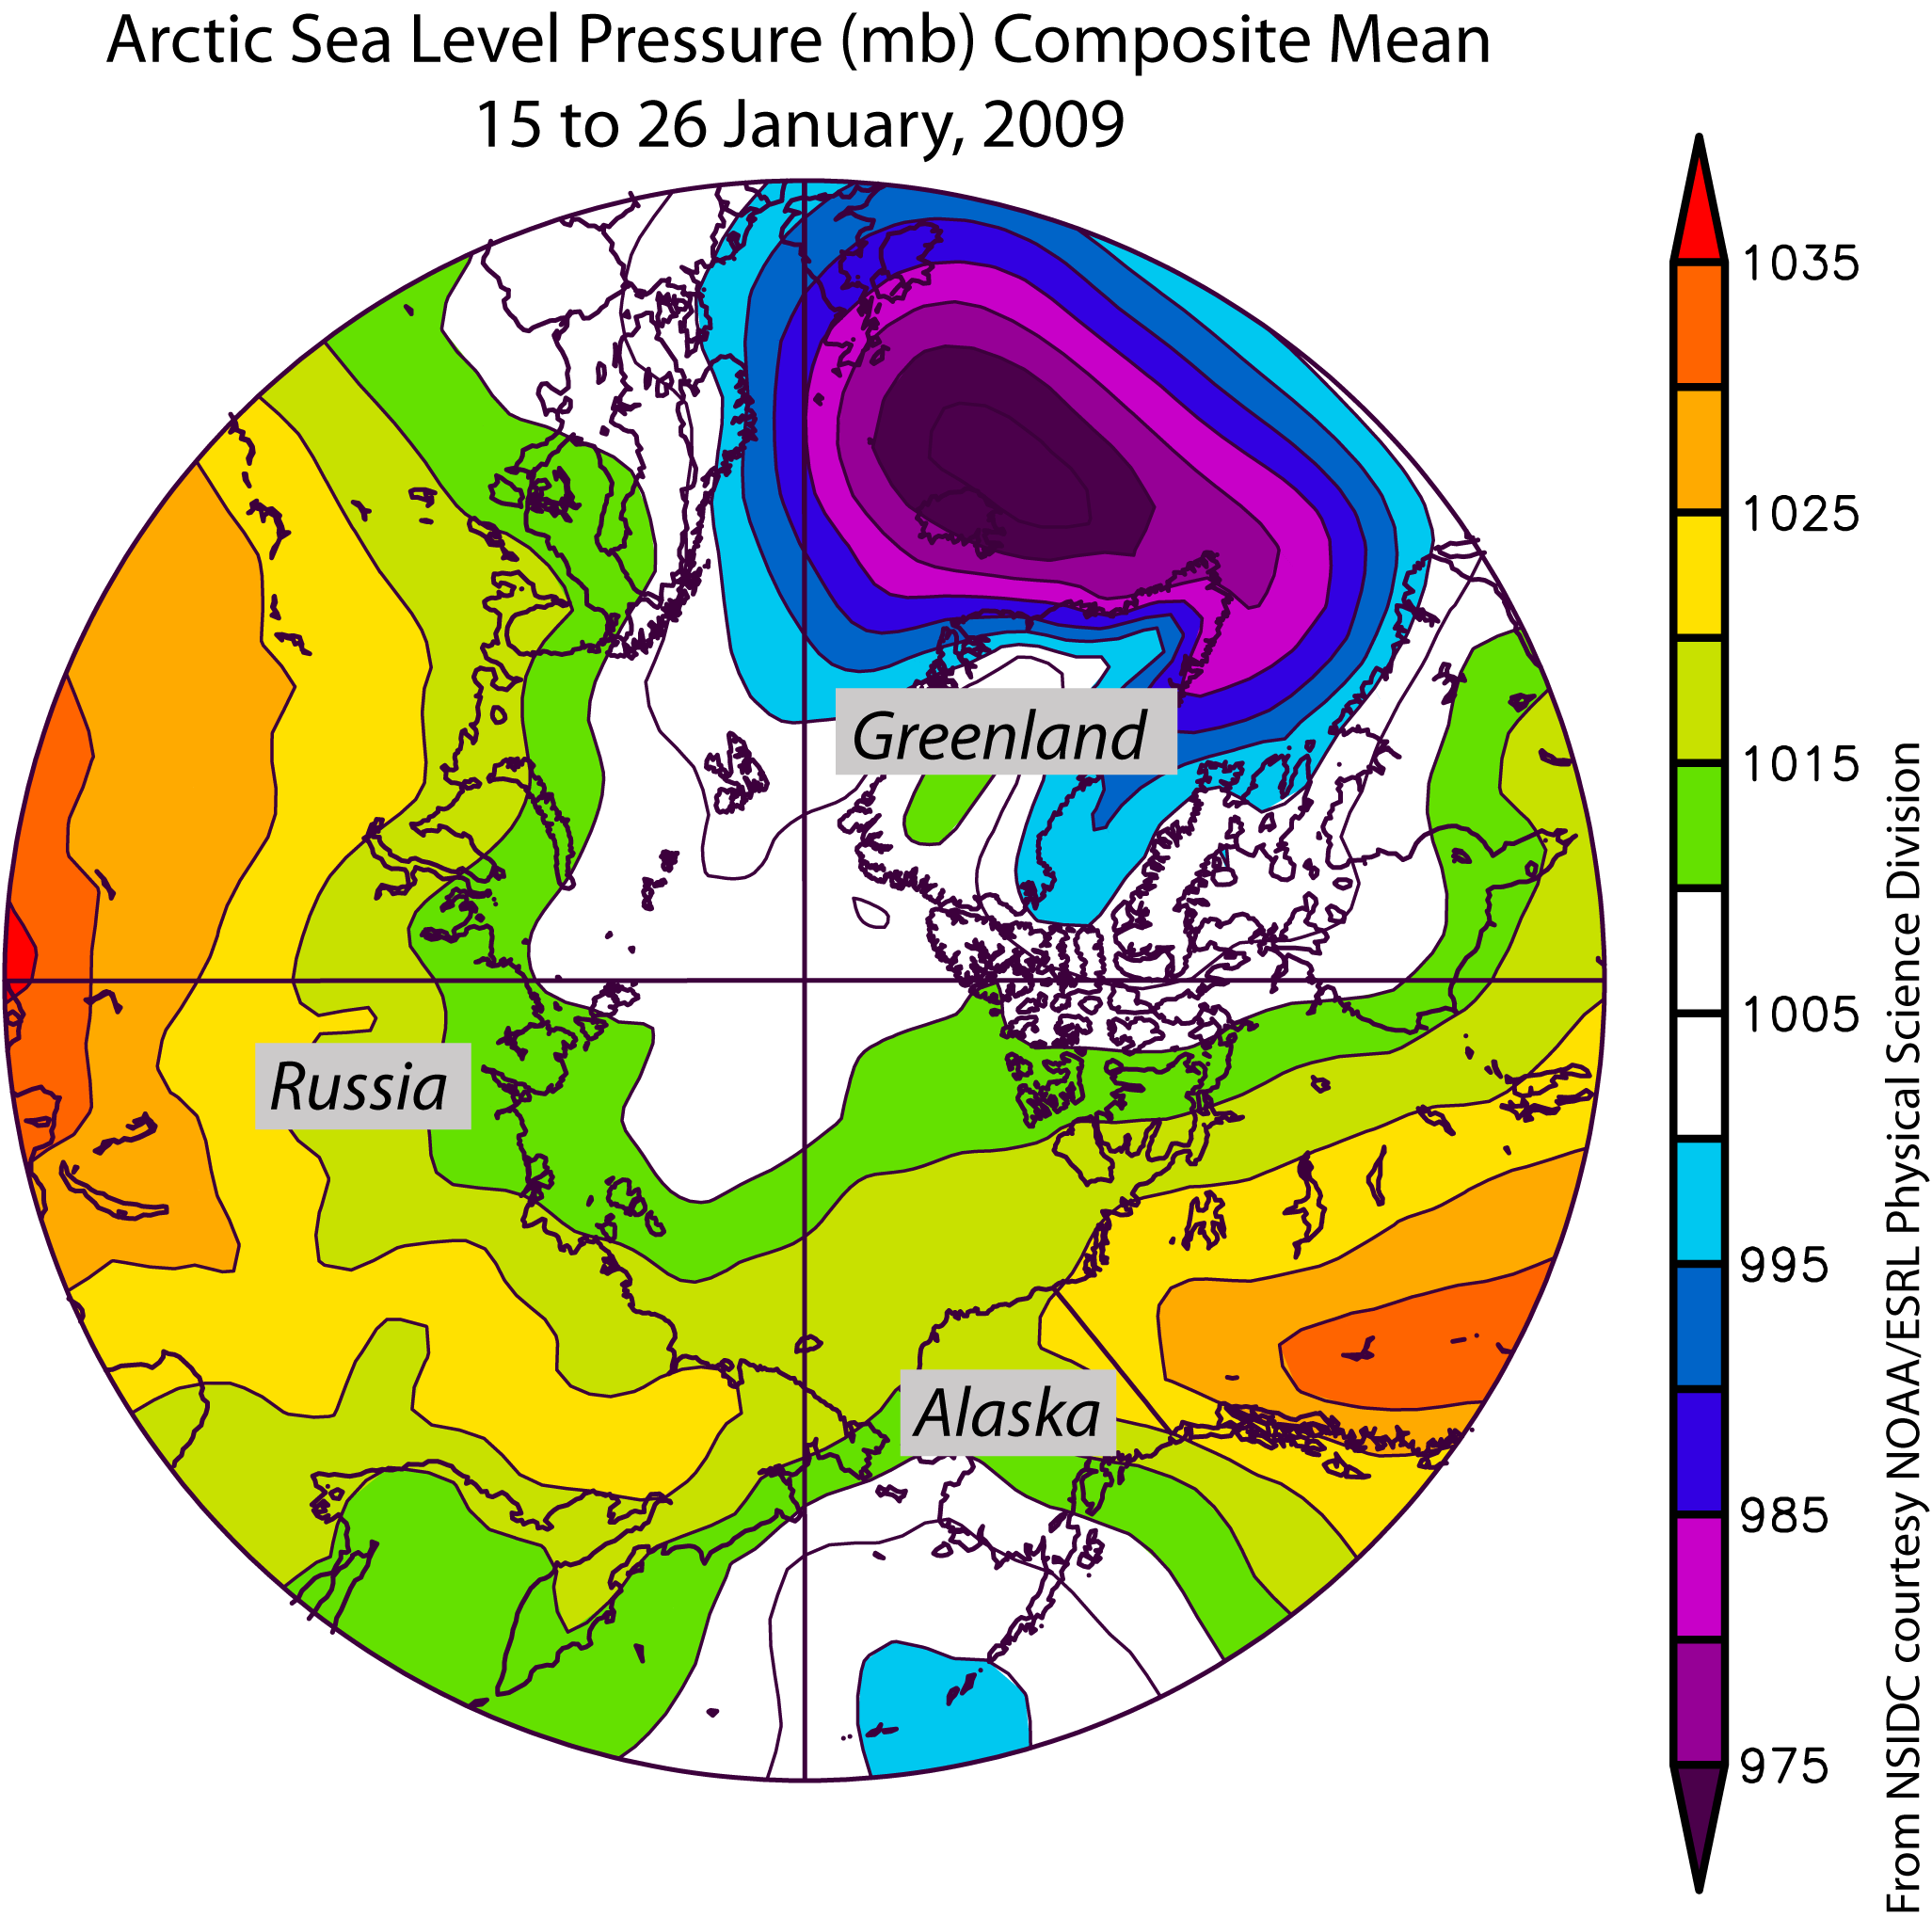
Chart showing year-long extent lines for 1979-2000 average, 2007, and 2008Figure 5. The map of sea level pressure (in millibars) averaged over the Arctic for the period January 1526, 2009, reveals one of the reasons for the pause in ice extent change—the strong low-pressure feature (blue and purple) centered just south of Iceland. Credit: From National Snow and Ice Data Center courtesy NOAA/ESRL Physical Sciences Laboratory

High-resolution image

The reason for the pause in January average ice extent change

The pause in ice extent change from January 15 to 26 is somewhat similar to an event that characterized part of December 2008. Both times, the cause for the pause was an unusual pattern of atmospheric circulation.

January 1526 saw very strong low pressure centered just south of Iceland—a very strong Icelandic Low . In accord with Buys Ballot's Law, strong warm winds from the south and southeast encouraged ice decline in areas east of Greenland and in parts of the Barents Sea area. The winds helped compact the ice cover and reduce ice growth. Regional winds from the north explain the increases in ice extent southwest of Greenland.

This strong Icelandic Low was present at the same time that atmospheric pressures were especially high over the subtropical North Atlantic. This large-scale pattern of atmospheric pressure and the regional pattern of changes in ice extent on the Atlantic side of the Arctic are classic signals of the positive phase of the North Atlantic Oscillation (NAO). The negative phase would have a weaker Icelandic Low, and roughly the inverse pattern of sea ice extent anomalies (the red and green in Figure 4 would be approximately reversed). The NAO has climate impacts not just in the Arctic, but in North America and Europe as well.

References

Rigor, I. G., J. M. Wallace, and R. L. Colony. 2002. Response of sea ice to the Arctic Oscillation. AMS Journal of Climate, Vol. 15(18), 2648–2663.

For previous analysis, please see the drop-down menu under Archives in the right navigation at the top of this page.

Link to this page (the content on this page will change as it is updated periodically): http://www.nsidc.org/arcticseaicenews/