Showing posts with label Polar vortex. Show all posts

Arctic Oscillation Index, Surface Temperature Anomalies, Polar Vortex, Chris Mooney's "Water World"

Dear Readers,

Here is a link to an animation of the past 30 days' surface temperature anomalies (note the red color over Greenland):


http://www.esrl.noaa.gov/psd/map/images/fnl/sfctmpmer_01a_30frames.fnl.anim.html


Here is a link to NASA's Earth Observatory of how hot air was belched out into the stratosphere over the North Pole in February 2009 (the 7-Mb animation takes a very long time to load, but I guarantee you it is worth the wait and is scary to watch).


Link to NASA article:


http://earthobservatory.nasa.gov/IOTD/view.php?id=36972


Link to QuickTime animation (by way of explanation, please note that the image on the right shows temperatures at an altitude of about 30 kilometers. The temperatures begin at a low of negative 88 degrees centigrade (-88 °C).  As the heat is belched through the polar vortex, splitting it in two, temperatures rise to a positive 12 degrees centigrade (+12 °C) . Note also that the heat is coming from the southern latitudes just north of the equator.):


http://earthobservatory.nasa.gov/images/imagerecords/36000/36972/npole_gmao_200901-02.mov


Here is a link to NOAA's National Weather Service's Climate Predition Center's daily graph of the Arctic Oscillation Index:


http://www.cpc.noaa.gov/products/precip/CWlink/daily_ao_index/ao_index.html


Graph as of January 6, 2009:


Observed Daily Arctic Oscillation Index.


And, just for fun, boys and girls, a link to the Western Hemisphere and (some of the Eastern) water vapor streams over the past 24 hours:


http://cimss.ssec.wisc.edu/tropic/real-time/mosaic/movies/moswwvbbm/moswwvbbmjava.html


And, a quote from Chris Mooney's book "Storm World" (page 57) that Susan A. was so kind to send to me:


"The 'most important and obvious' positive feedback identified in the Charney report involved atmospheric water vapor. Due to a physical law known as the Clausius-Clapeyron equation, the amount of moisture that can be carried by the air increases along a steeply sloping curve as temperature rises."


Emphasis and underlining are mine.

The weakening of the polar vortex in the Arctic

First, what is the polar vortex?  I will have to post what others have written:

From the National Snow and Ice Data Center:

The Polar Vortex

The polar vortex is a persistent large-scale cyclonic circulation pattern in the middle and upper troposphere and the stratosphere, centered generally in the polar regions of each hemisphere. In the Arctic, the vortex is asymmetric and typically features a trough (an elongated area of low pressure) over eastern North America. It is important to note that the polar vortex is not a surface pattern. It tends to be well expressed at upper levels of the atmosphere (that is, above about five kilometers).

And, what is the AO or Arctic oscillation?

The Arctic Oscillation

The Arctic Oscillation refers to opposing atmospheric pressure patterns in northern middle and high latitudes.

The oscillation exhibits a "negative phase" with relatively high pressure over the polar region and low pressure at midlatitudes (about 45° North), and a "positive phase" in which the pattern is reversed. In the positive phase, higher pressure at midlatitudes drives ocean storms farther north, and changes in the circulation pattern bring wetter weather to Alaska, Scotland and Scandinavia, as well as drier conditions to the western United States and the Mediterranean. In the positive phase, frigid winter air does not extend as far into the middle of North America as it would during the negative phase of the oscillation. This keeps much of the United States east of the Rocky Mountains warmer than normal, but leaves Greenland and Newfoundland colder than usual. Weather patterns in the negative phase are in general "opposite" to those of the positive phase, as illustrated below.

Over most of the past century, the Arctic Oscillation alternated between its positive and negative phases. Starting in the 1970s, however, the oscillation has tended to stay in the positive phase, causing lower than normal arctic air pressure and higher than normal temperatures in much of the United States and northern Eurasia.
Arctic Oscillation
Effects of the Positive Phase      |     Effects of the Negative Phase
of the Arctic Oscillation                    of the Arctic Oscillation
(Figures courtesy of J. Wallace, University of Washington)


Semipermanent Highs and Lows

The Arctic is characterized by "semipermanent" patterns of high and low pressure. These patterns are semipermanent because they appear in charts of long-term average surface pressure. They can be considered to largely represent the statistical signature of where transitory high and low systems that appear on synoptic charts tend to be most common.

Aleutian Low

This semipermanent low pressure center is located near the Aleutian Islands. Most intense in winter, the Aleutian Low is characterized by many strong cyclones. Traveling cyclones formed in the subpolar latitudes in the North Pacific usually slow down and reach maximum intensity in the area of the Aleutian Low.

Icelandic Low

This low pressure center is located near Iceland, usually between Iceland and southern Greenland. Most intense during winter, in summer, it weakens and splits into two centers, one near Davis Strait and the other west of Iceland. Like its counterpart the Aleutian Low, it reflects the high frequency of cyclones and the tendency for these systems to be strong. In general, migratory lows slow down and intensify in the vicinity of the Icelandic Low.

Siberian High

The Siberian High is an intense, cold anticyclone that forms over eastern Siberia in winter. Prevailing from late November to early March, it is associated with frequent cold air outbreaks over east Asia.

Beaufort High

The Beaufort High is a high pressure center or ridge over the Beaufort Sea present mainly in winter.

North American High (not the one in California on the beach, ok)

The North American High is a relatively weak area of high pressure that covers most of North America during winter. This pressure system tends to be centered over the Yukon, but is not as well-defined as its continental counterpart, the Siberian High.
From the National Weather Service's Climate Prediction Center:

The Arctic Oscillation Index


Observed Daily Arctic Oscillation Index.

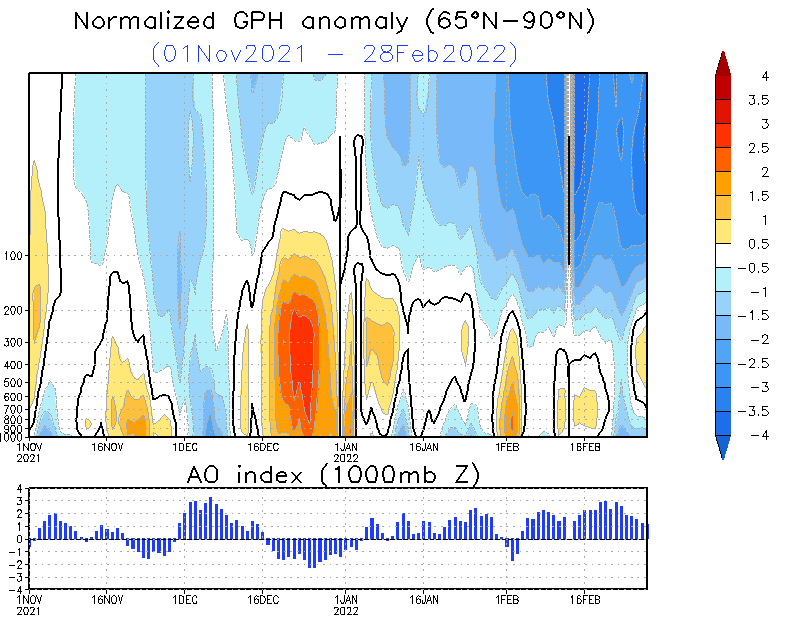
Vertical Cross section of Geopotential Height Anomalies and AO index. Click on image to enlarge.
(Click on image to enlarge)
The daily geopotential height anomalies at 17 pressure levels are shown for the previous 120 days as indicated, and they are normalized by standard deviation using 1979-2000 base period. The anomalies are calculated by subtracting 1979-2000 daily climatology, and then averaged over the polar cap poleward of 65°N.

The blue (red) colors represent a strong (weak) polar vortex. The black solid lines show the zero anomalies.


The daily AO indices are shown for the previous 120 days, and the ensemble forecasts of the daily AO index at selected lead times are appended onto the time series. The indices are standardized by standard deviation of the observed monthly AO index from 1979-2000. A 3-day running mean is applied to the forecast time series.

The values at the upper left and right corners of each figure indicate the mean value of the AO index and the correlation coefficients between the observations and the forecasts, respectively.

The first panel shows the observed AO index (black line) plus forecasted AO indices from each of the 11 GFS ensemble members starting from the last day of the observations (red lines).

The ensemble mean forecasts of the AO index are obtained by averaging the 11 GFS ensemble members (blue lines), and the observed AO index (black line) is superimposed on each panel for comparison. For the forecasted indices (lower 3 panels), the yellow shading shows the ensemble mean plus and minus one standard deviation among the ensemble members, while the upper and lower red lines show the range of the forecasted indices, respectively.

 
GFS Ensemble Arctic Oscillation Outlooks
Link:  http://www.cpc.ncep.noaa.gov/products/precip/CWlink/daily_ao_index/ao_index_ensm.shtml


From NCAR (for those with a more high-tech bend than I have:

The breakdown of the Stratospheric Polar Night Vortex is an atmospheric event that occurs once or twice each year in the polar wintertime stratosphere. As the polar vortex is formed, sharp gradients of potential vorticity at the vortex edge isolate polar air from the air at lower latitudes, producing conditions favorable for wintertime polar ozone depletion. Rossby waves propagating upward from the troposphere along the edge of the Polar Vortex grows exponentially in amplitude, eventually tearing the vortex apart.
Related Links
 
 High Resolution Simulation


The animations depict the flow of the Polar Vortex by visualizing Potential Vorticity (a variable that acts as a tracer) over the 16-day simulation. In the second and succeeding images, the height of the data has been greatly exaggerated to better show the rich vertical structure contained in the vortex. In reality, the vortex is only a few tens of kilometers thick, a pancake-thin region that can extend over much of the Northern Hemisphere.


This image shows a satellite view of the earth from space with three isosurfaces of Potential Vorticity mapped over the Northern Hemisphere from day 16 of the simulation. Brighter colors correspond to increasing Potential Vorticity. The animations at right, show the entire 16-day evolution

H. Douville, GRL (2009), Stratospheric polar vortex influence on Northern Hemisphere winter climate variability

Geophysical Research Letters, 36 (2009) L18703; doi: 10.1029/2009GL039334.

Stratospheric polar vortex influence on Northern Hemisphere winter climate variability

H. Douville (CNRM, GAME, Météo-France, CNRS, Toulouse, France)

Received 8 June 2009; accepted 18 August 2009; published 23 September 2009.

Abstract

Given the low skill of seasonal forecasts in the Northern Hemisphere, it is important to look for extra sources of long-range predictability in addition to the global distribution of sea surface temperature (SST). Former studies have suggested the potential contribution of the stratosphere but have never really quantified this influence and compared it to the SST forcing. In the present study, two ensembles of global atmospheric simulations driven by observed SST and radiative forcings have been performed over the 1971–2000 period. In the perturbed experiment, the stratospheric dynamics and temperature is nudged towards the ERA40 reanalyses north of 25°N in order to mimic a “perfect” polar vortex. The comparison with the control experiment reveals a strong improvement in the simulation of the Arctic and North Atlantic Oscillation, with obvious positive impacts on the interannual variability of winter surface air temperature and precipitation, especially over Europe.

Douville, H. (2009), Stratospheric polar vortex influence on Northern Hemisphere winter climate variability, Geophys. Res. Lett., 36, L18703; doi: 10.1029/2009GL039334.

Link to abstract:  http://www.agu.org/pubs/crossref/2009/2009GL039334.shtml

TWC: Bird's eye view of the North Pole and how the weakening of the polar vortex is allowing not so good things to go on weatherwise

OK, readers, that was a really silly title, I know.

But, I don't know how else to state it. Please click on the image to enlarge it. If you look carefully at the clouds, you can see that France is dry and so is the entire western half of the U.S.

If the polar vortex is too weak to keep the warm air currents far enough south, then they keep going north.

Sure, sometimes the west is dry and so is France, but I just thought this was a nice image to demonstrate what is likely to be a more dominant weather pattern when the Arctic warms up.


Blogger Enno said...
heh that was funny! but -- "what is likely to be a more dominant weather pattern" ...can you state or link to some substantiation why/how one knows that this specific pattern is likely to be more dominant? Thank you for your blog, generally.
September 29, 2009 3:14 PM
Delete
Blogger Tenney Naumer said...
Dear Enno,Thanks for your comment!For substantiation, please click on the relevant labels, e.g., "storm tracks...," polar vortex, and other related labels.There is plenty of research being done on these things, and whenever I run across it, I make a point to post it to the blog.Best regards,Tenney
September 30, 2009 8:47 AM

K. Delthloff et al.,The climate system of the Earth from a polar perspective

Nuuk Climate Days 2009: Changes of the Greenland Cryosphere Workshop & The Arctic Freshwater Budget International Symposium, Nuuk, Greenland, 25-27 August 2009


Primary author: DELTHLOFF, Klaus (Alfred Wegener Institute for Polar and Marine Research (AWI),
Germany), Klaus.Dethloff@awi.de.  Co-authors: RINKE, A. (Alfred Wegener Institute for Polar and Marine Research); HANDORF, D. (Alfred Wegener Institute for Polar and Marine Research); DORN, W. (Alfred Wegener Institute for Polar and Marine Research); BRAND, S. (Alfred Wegener Institute for Polar and Marine Research); MIELKE, M. (Alfred Wegener Institute for Polar and Marine Research); GRAESER, J (Alfred Wegener Institute for Polar and Marine Research); HERBER, A. (Alfred Wegener Institute for Polar and Marine Research)

Abstract ID: F1

The climate system of the Earth from a polar perspective


Balloon and radio sounding data from the North Pole drifting station NP35 for autumn 2007 to spring 2008 have been used to evaluate numerical model outputs (simulations with the regional climate model HIRHAM, ECMWF analyses). HIRHAM in the climate mode has some difficulty to represent the observed complex temperature profile, while the forecast mode shows better agreement. Sensitivity experiments concerning the atmospheric initial state, sea ice thickness and planetary boundary layer parameterization demonstrate improvements in the simulations.

Similar measurements have been carried out during spring 2009 on NP 36 and with the AWI airplane POLAR 5 over the Arctic Ocean. The pilot-project PAM-RCM (Pan-Arctic Measurements and Arctic Regional climate model simulations) provided a unique opportunity to obtain a snapshot of aerosol and cloud distributions and associated meteorological and atmospheric conditions as well as measurements of sea ice thickness in a latitude band between about 70°N and 80°N.

Sensitivity experiments using a coupled regional atmosphere-ocean-ice model of the Arctic has been conducted in order to identify the requirements needed to reproduce observed sea-ice conditions and to address uncertainties in the description of Arctic processes. While more sophisticated schemes for the albedo, the treatment of lateral freezing and melting, and the snow cover have been successfully introduced into the model, the parameterization of clouds is an open issue.

The global influence of Arctic feedbacks connected with sea-ice albedo changes and stratospheric ozone changes have been investigated. The simulations show significant changes over the Arctic and the whole globe due to changes of planetary wave patterns, which trigger the Arctic Oscillation (AO) and influences the sea -ice cover.

The impact of an interactive stratospheric ozone chemistry on the tropospheric circulation has been studied on the basis of the atmosphere-ocean-sea ice general circulation model ECHO-GiSP. The results show a sensitivity of the tropospheric circulation dynamics to the stratospheric chemistry. With enabled interactive stratospheric chemistry the model tends to the negative phase of the AO mode and a more unstable polar vortex..

Contact for symposium information:  Sune Nordentoft Lauritsen, e-mail: snl@space.dtu.dk

NSIDC Report of August 18, 2009: A change in ice motion slows seasonal decline

NSIDC Report of August 18, 2009: A change in ice motion slows seasonal decline

During the first half of August 2009, Arctic ice extent declined more slowly than during the same period in 2007 and 2008. The slower decline is primarily due to a recent atmospheric circulation pattern, which transported ice toward the Siberian coast and discouraged export of ice out of the Arctic Ocean. It is now unlikely that 2009 will see a record low extent, but the minimum summer ice extent will still be much lower than the 1979 to 2000 average.

Note: This mid-monthly analysis update shows a single-day extent value for Figure 1, rather than the usual monthly average. While monthly average extent images are more accurate in understanding long-term changes, the daily images are helpful in monitoring sea ice conditions in near-real time.

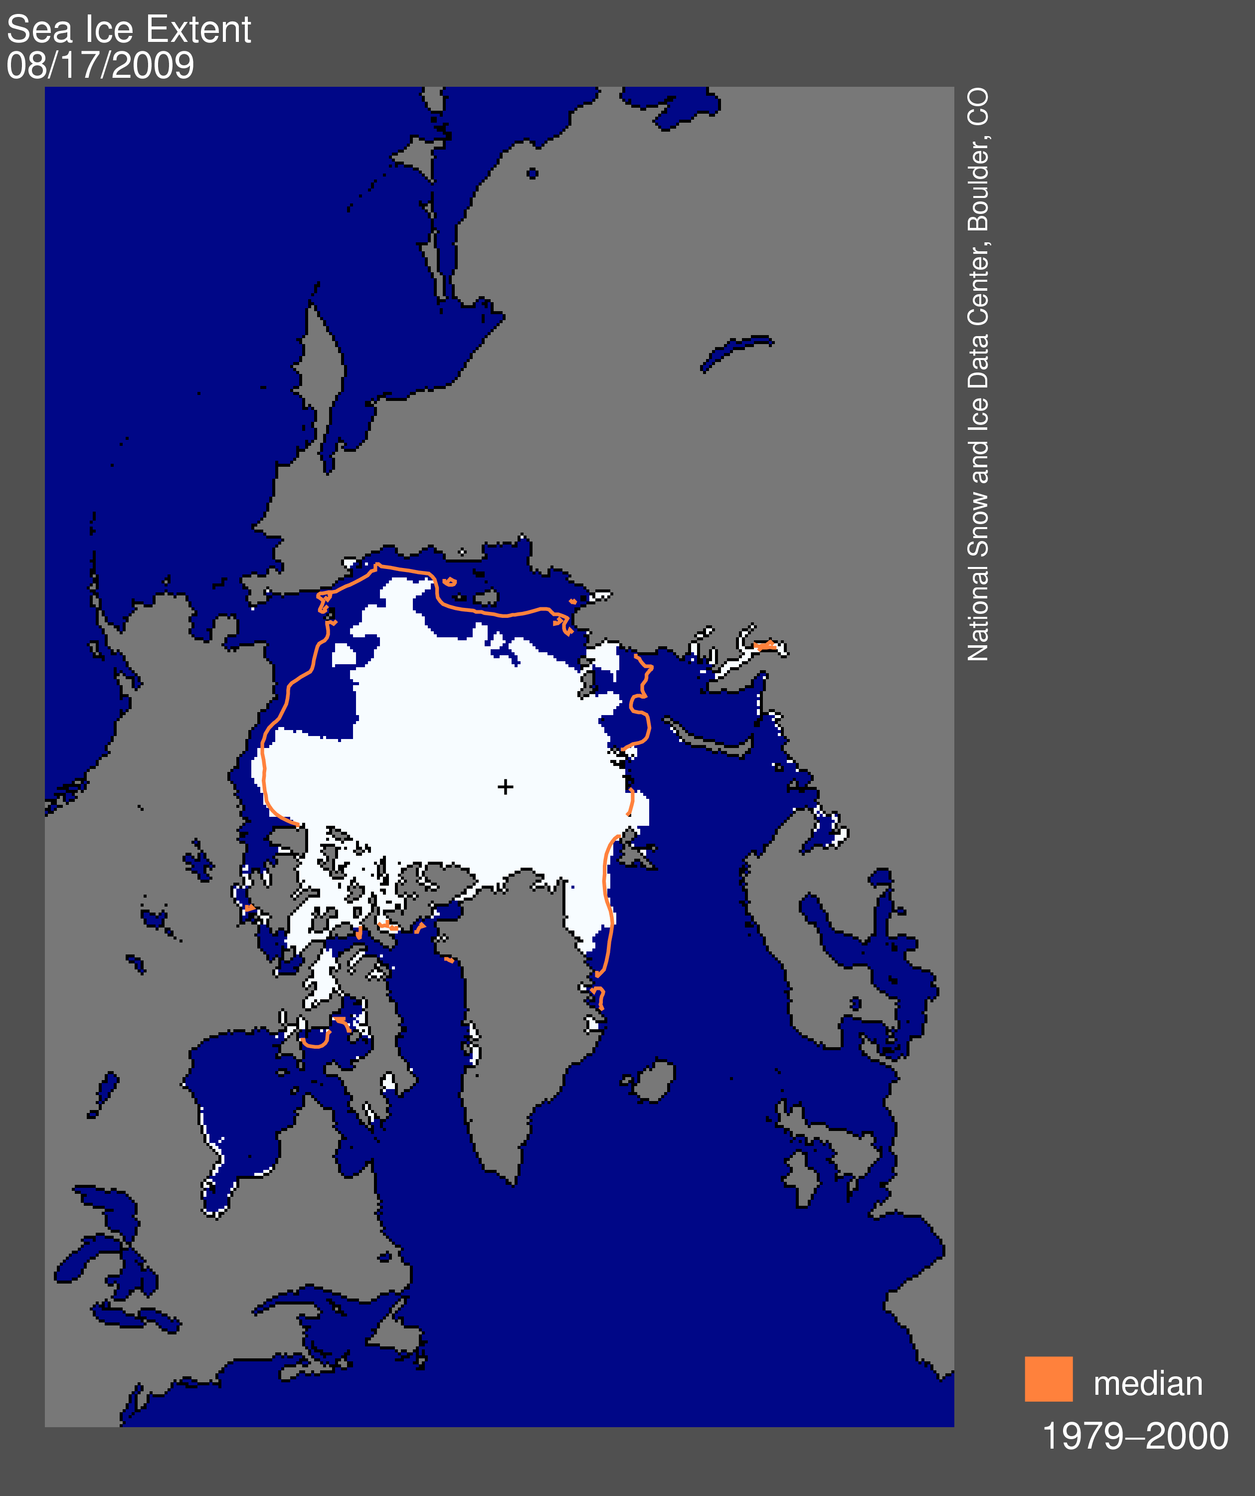
map from space showing sea ice extent, continentsFigure 1. Daily Arctic sea ice extent on August 17, 2009, was 6.26 million km² (2.42 million sq. miles). The orange line shows the 1979-2000 median extent for that day. The black cross indicates the geographic North Pole. Sea Ice Index data. About the data. —Credit: National Snow and Ice Data Center. High-resolution image

Overview of conditions

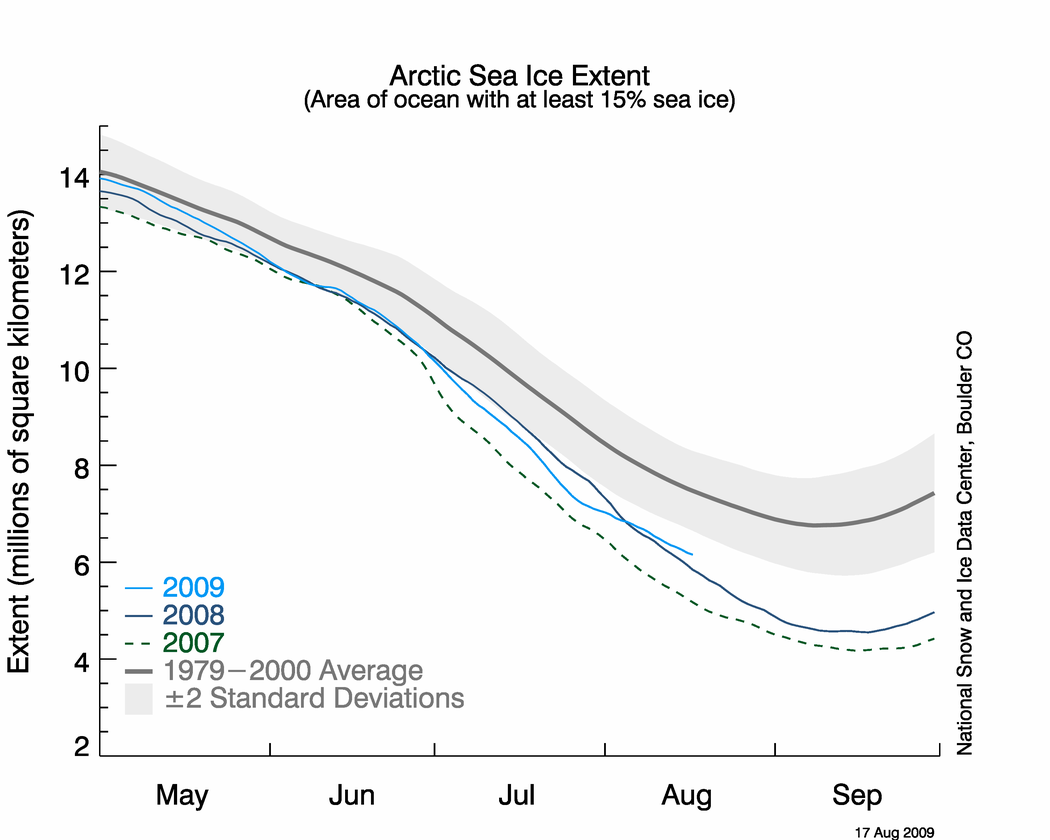
On August 17, 2009, Arctic sea ice extent was 6.26 million km² (2.42 million sq. miles). This is 960,000 km² (370,000 sq. miles) more ice than for the same day in 2007, and 1.37 million km² (530,000 sq. miles) below the 1979-2000 average. On August 8, the 2009 extent decreased below the 1979-2000 average minimum annual extent, with a month of melt still remaining.

graph with months on x axis and extent on y axis Figure 2. The graph above shows daily sea ice extent as of August 17, 2009. The solid light blue line indicates 2009; the solid dark blue line shows 2008; the dashed green line shows 2007; and the solid gray line indicates average extent from 1979 to 2000. The gray area around the average line shows the two standard deviation range of the data. Sea Ice Index data. —Credit: National Snow and Ice Data Center. High-resolution image

Conditions in context

From August 1 to 17, Arctic sea ice extent declined at an average rate of 54,000 km² (21,000 sq. miles) per day. This decline was slower than the same period in 2008, when it was 91,000 km² (35,000 sq. miles) per day, and for the same period in 2007, when ice extent declined at a rate of 84,000 km² (32,000 sq. miles) per day. The recent rate of ice loss has slowed considerably compared to most of July. Arctic sea ice extent is now greater than the same day in 2008.

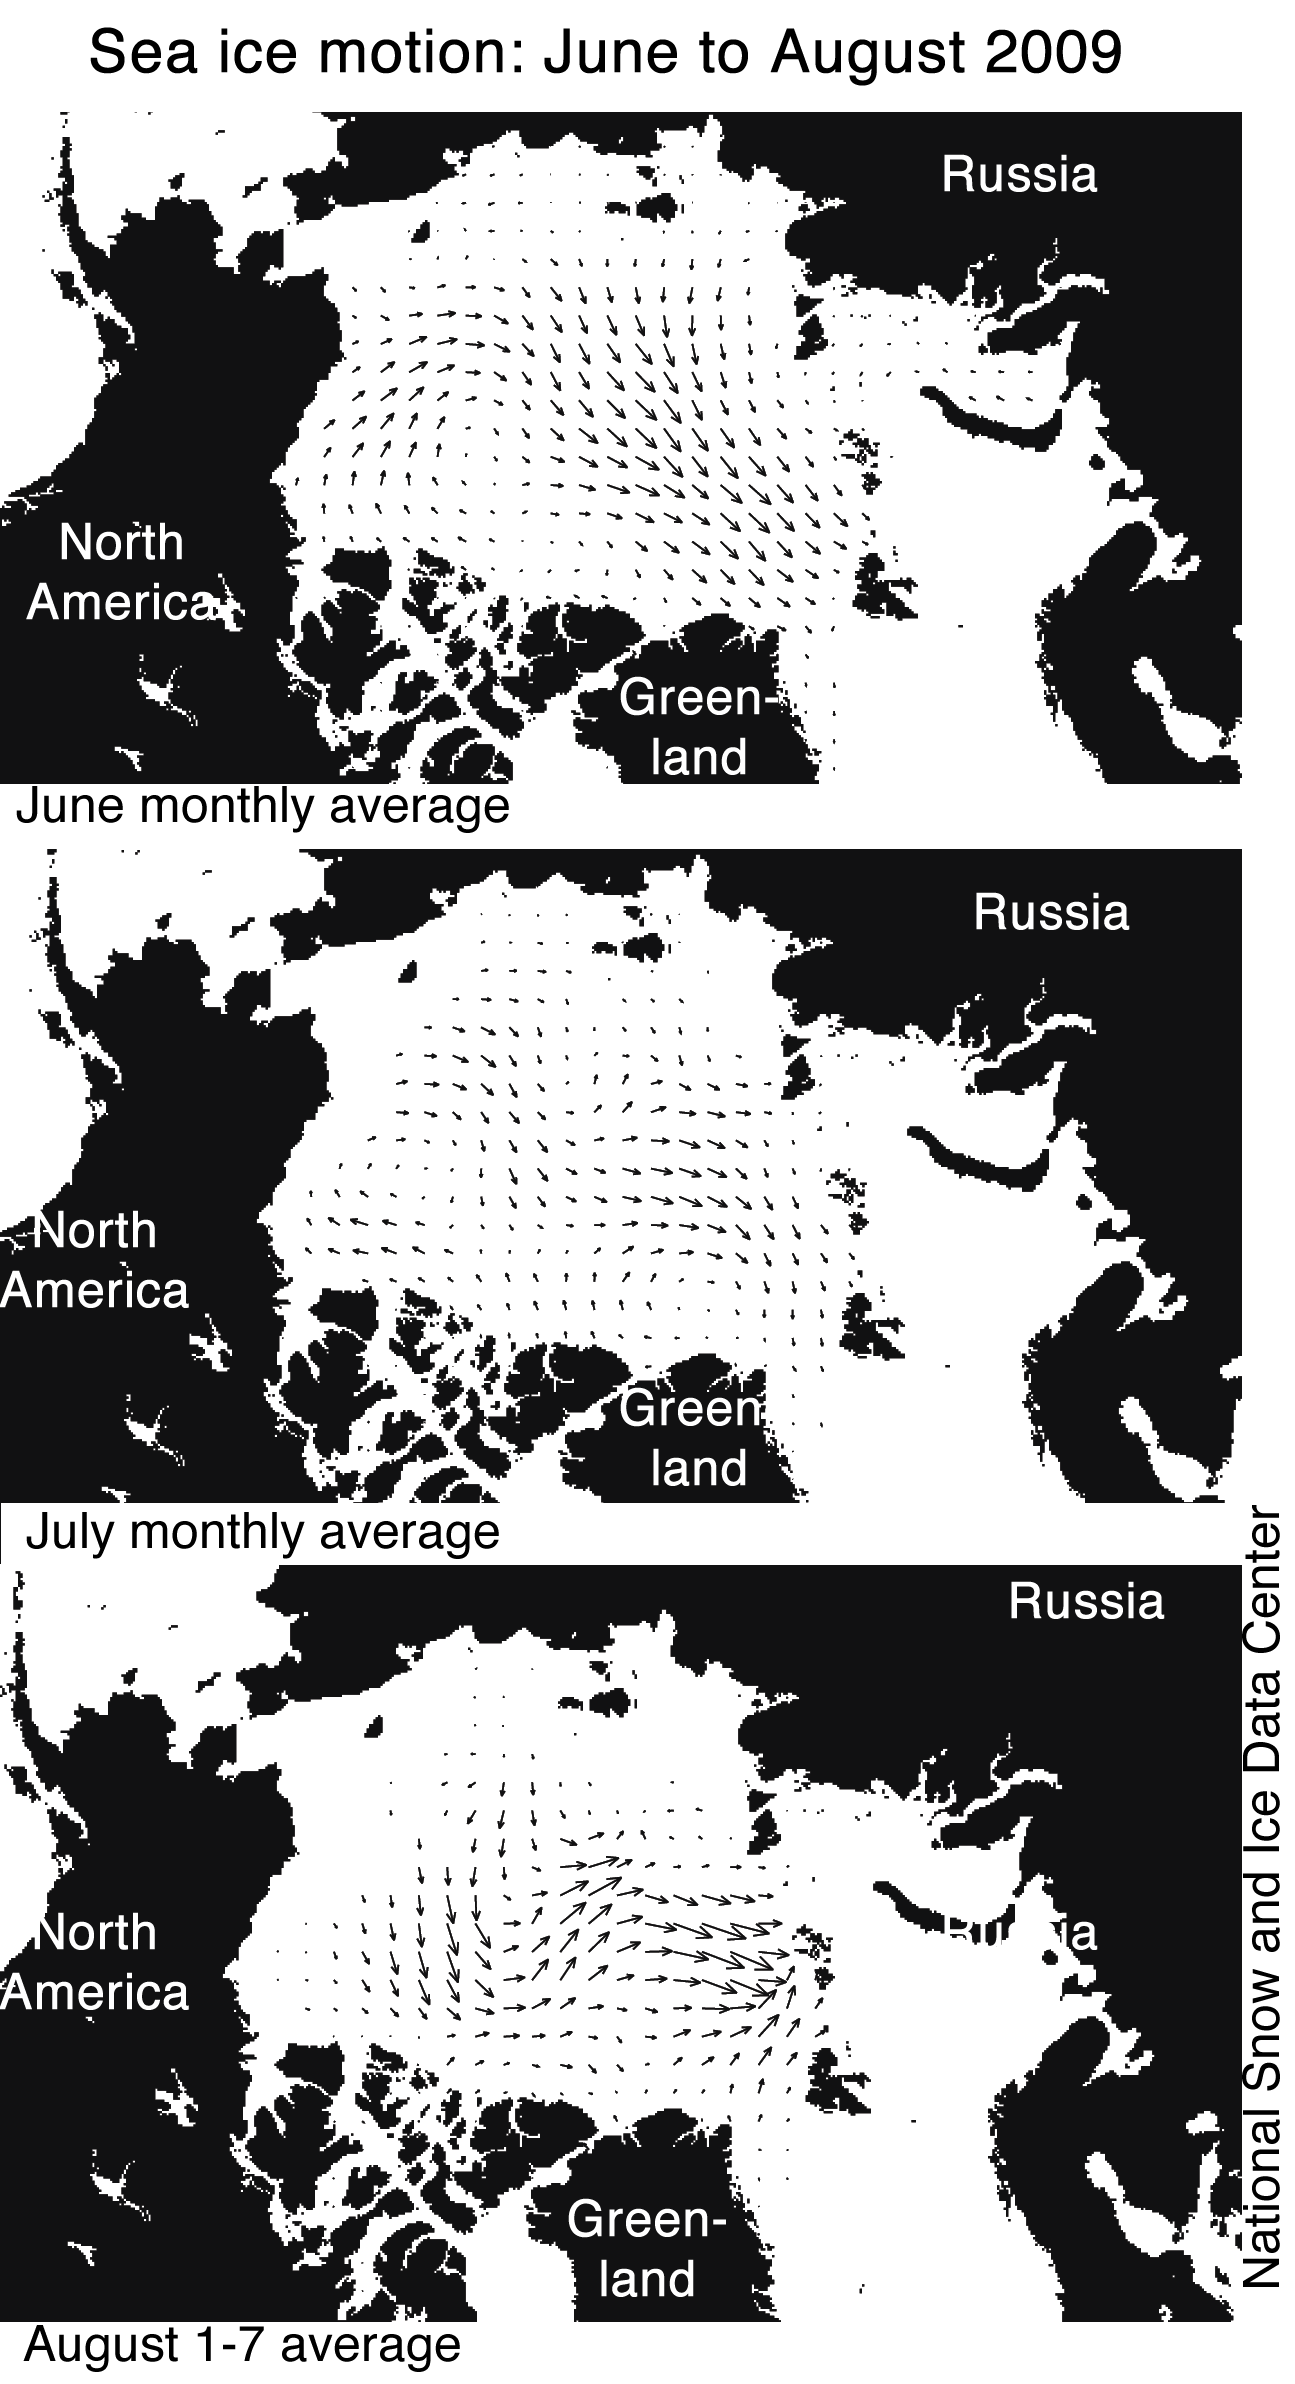
average monthly data from 1979-2009 for July Figure 3. Sea ice motion, derived from AMSR-E data and averaged for June, July, and the first week of August 2009 (the most recent data available), shows a recent change, with ice motion towards the eastern Siberian coast and little export of ice out of the Arctic Ocean via Fram Strait. —Credit: National Snow and Ice Data Center. High-resolution image

Ice motion changes in August

A recent atmospheric circulation pattern, which led to a change in ice motion, caused the ice loss rate to slow down significantly in the first two weeks of August. As discussed in the August 4 post, during much of June and July, a strong Beaufort Sea high-pressure pattern promoted winds that helped push ice out of the Siberian coastal seas, and also brought clear skies and warm temperatures that helped induce melt.

Toward the end of July, the atmospheric pattern changed. Averaged over the past two weeks, a high-pressure system has been centered over the Barents Sea, with low pressure centered over the Laptev Sea. In accordance with Buys Ballot's Law, this pattern led to winds that redirected the motion of the ice cover, pushing the ice edge outward toward the Siberian coast and discouraging ice from exiting the Arctic Ocean through Fram Strait.

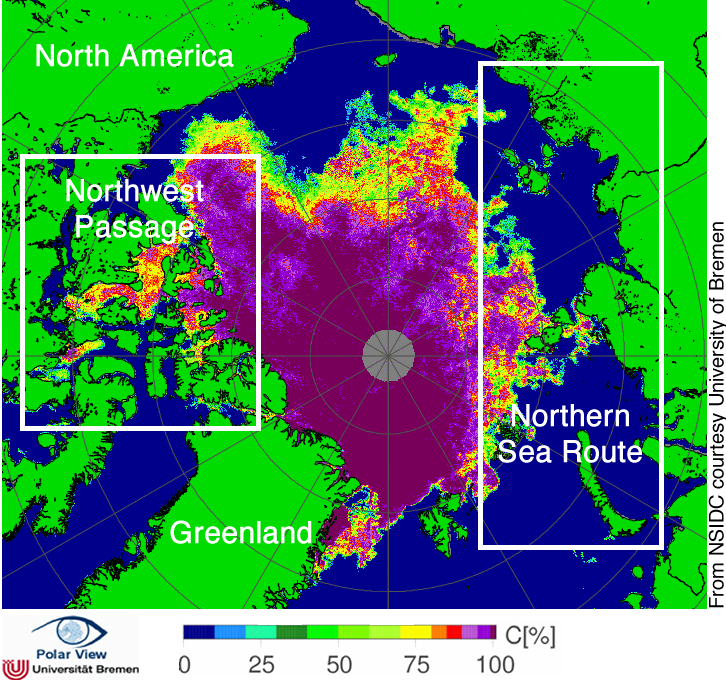
map of arctic showing sea level pressure and atmospheric circulation patterns Figure 4. The map of sea ice concentration from AMSR-E from August 16, 2009, shows ice clogging many of the channels of the Canadian Archipelago. The Northern Sea Route may be clear in the next few weeks. NASA AMSR-E data. —Credit: From National Snow and Ice Data Center, courtesy IUP, University of Bremen, Germany. High-resolution image

The Northwest Passage and Northern Sea Route

So far this year, neither the Northwest Passage nor the Northern Sea Route has opened. The Northern Sea Route appears likely to open soon, but ice still clogs many of the channels in the Northwest Passage.

Whether or not the navigational passages through the Arctic Ocean will open in a given summer depends on atmospheric circulation and ice thickness. For example, although 2007 was a record low extent in the Arctic and the Northwest Passage was nearly completely open, the Northern Sea Route was still choked with ice because of a circulation pattern that pushed a tongue of ice against the Siberian coast. Recent research by Stephen Howell at the University of Waterloo in Canada shows that whether the Northwest Passage clears depends less on how much melt occurs, and more on whether multi-year sea ice is pushed into the channels. Counterintuitively, as the ice cover thins, ice may flow more easily into the channels, preventing the Northwest Passage from regularly opening in coming decades.

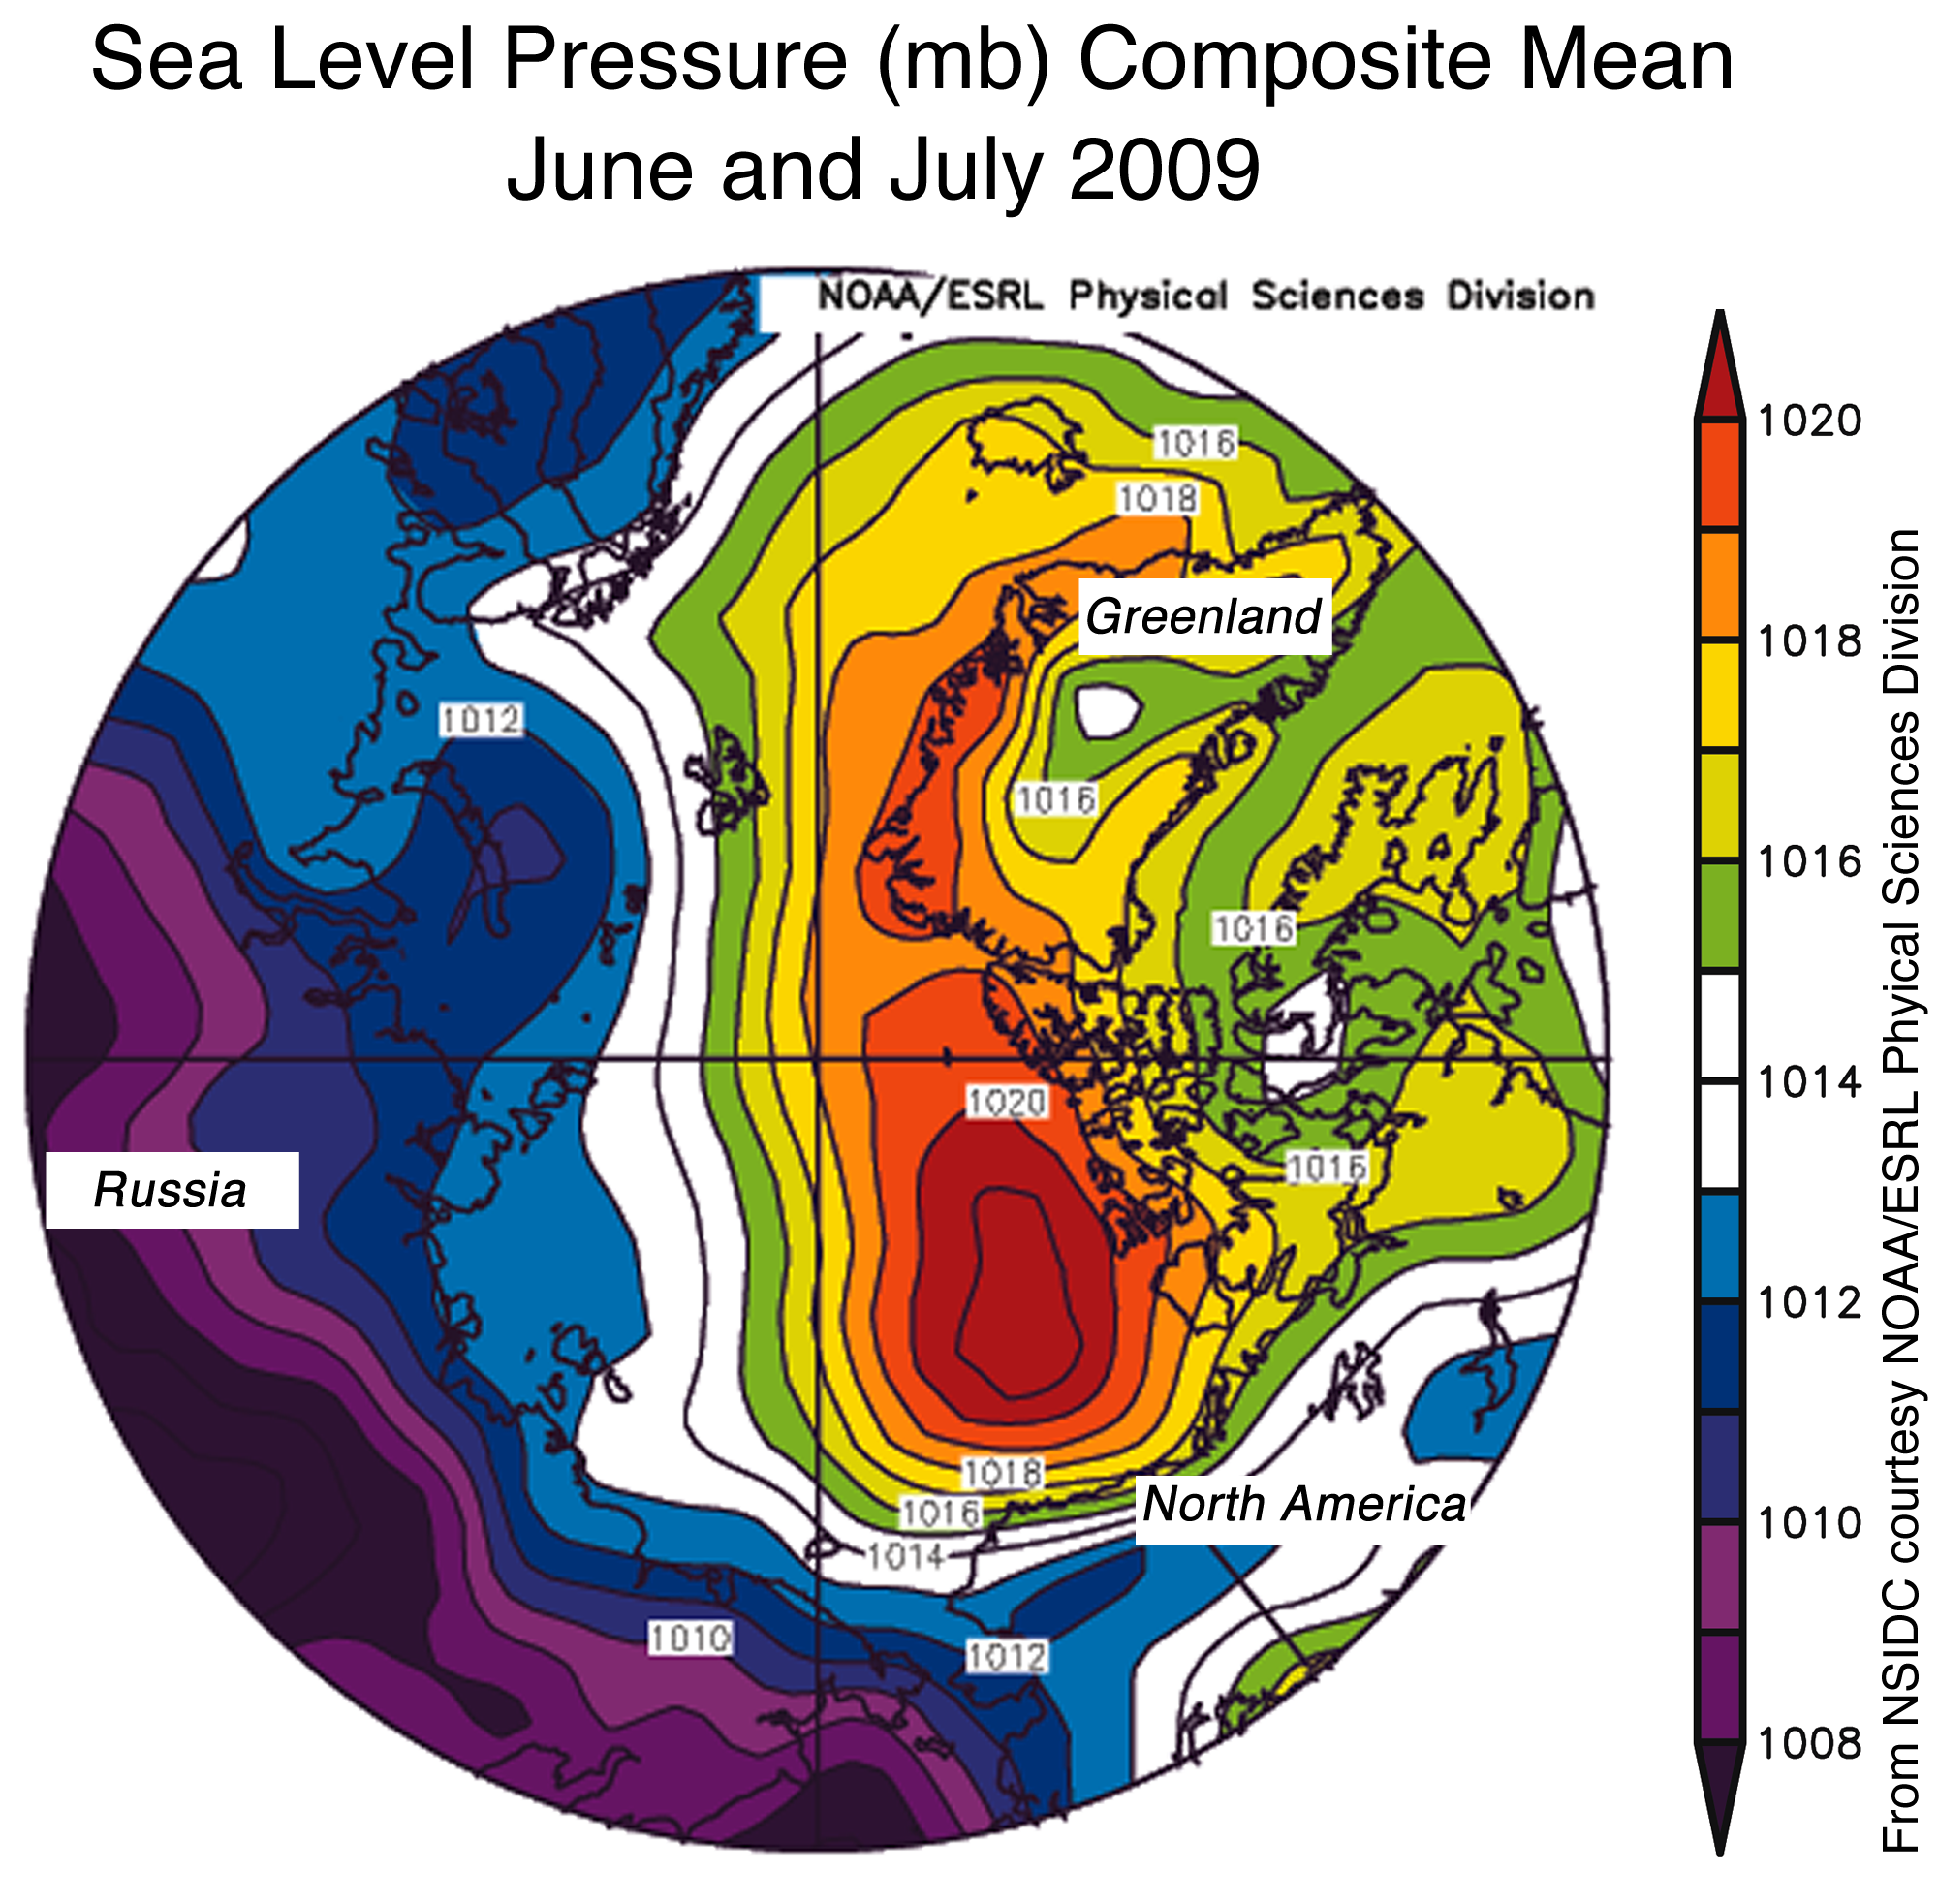
ice thickness from submarinesFigure 4. The map of sea level pressure (in millibars) from June and July 2009 shows a strong high-pressure cell over the Beaufort Sea, similar to the pattern in 2007. In the past, such patterns were rare. —Credit: From National Snow and Ice Data Center, courtesy NOAA/ESRL Physical Sciences Division. High-resolution image

Comment on atmospheric circulation patterns

James Overland of the NOAA Pacific Marine Environmental Laboratory in Seattle, Washington, has taken a close look at patterns of atmospheric circulation in recent summers. Overland notes that the periods June through August 2007 and June and July 2009 both saw an unusual atmospheric pattern of sea level pressure, with higher pressure on the Alaskan side of the Arctic and lower pressure on the Eurasian side. This pressure difference brought warm air into the central Arctic and transported sea ice towards the Atlantic. Historically, such a pattern is a rare event—before 2007, it only occurred twice in 30 years. Normally, there is little difference in pressure across the Arctic during summer, and winds are slack.

This rare condition may result from the convergence of the three main patterns of climate variability: the Arctic Oscillation (AO) climate pattern, which features either high or low pressure over most of the Arctic; the positive phase of the Pacific North American (PNA) pattern, which is characterized by low pressure over the Bering Sea and high pressure over the Canadian Rockies; and the Arctic dipole pattern, which features high pressure on one side of the Arctic and low pressure on the other. In 2007 and 2009 all three patterns have been in play. A clue to the cause of these unusual conditions comes from the wind flow in the middle atmosphere. Normally winds flow in a counter-clockwise direction around the central Arctic Ocean, a flow known as the polar vortex. In the summers of 2007 and 2009 the polar vortex shifted to mostly to the Eurasian side of the Arctic, allowing higher pressures to develop on the Alaskan side. Scientists are now studying whether this dipole pattern will become more common in the future and whether the loss of summer sea ice itself is helping to make this pattern more frequent.

References

Howell, S. E. L., C. R. Duguay, & T. Markus. 2009. Sea ice conditions and melt season duration variability within the Canadian Arctic Archipelago: 1979–2008, Geophys. Res. Lett., 36, L10502; doi: 10.1029/2009GL037681.

Overland, J. E., & M. Wang. 2005. The third Arctic climate pattern: 1930s and early 2000s. Geophys. Res. Lett., 32(23), L23808; doi: 10.1029/2005GL024254.

Wang, M., N. A. Bond, & J. E. Overland. 2007. Comparison of atmospheric forcing in four sub-arctic seas. Deep-Sea Research II, 54, 2543-2559; doi: 10.1016/j.dsr2.2007.08.014

Catherine Brahic: Early springs show Siberia is warming fast

Early springs show Siberia is warming fast

by Catherine Brahic, New Scientist, August 1, 2007

Siberia is experiencing earlier springs, a study of satellite images has revealed. The trend is likely to be triggering more forest fires, say researchers, and to be linked to global warming.

In a study of a wide range of Siberian ecosystems, Heiko Baltzer of the University of Leicester, UK, and his colleagues found that from 1982 to 1999 spring began and peaked increasingly earlier for almost all the ecosystems.

The advance was greatest in urban environments, where the start of the growing season advanced by an average of 0.7 days per year -- a total of 12.6 days over the 18 years. The advance was also significant in non-evergreen broadleaf forests -- an average of 0.5 days every year.

The growing season is starting earlier because of warmer temperatures, which are causing the snow to melt earlier. "Global warming in Siberia is happening faster than the global average," says Baltzer. "This has been documented by the UN's Intergovernmental Panel on Climate Change."

Fuelling wildfires

Baltzer believes the early onset of spring is causing more and more forest fires in Siberia. "During the 19th century, a typical forest in Siberia had about 100 years after a fire to recover before it burned again. But new observations by Vjatcheslav Kharuk at the Russian Academy of Sciences have shown that fires now return more frequently -- about every 65 years during the 20th century," says Baltzer.

He says that a consequence of the snow melting earlier in the year -- triggering the start of the growing season -- is that the soil tends to be drier later on in the year. This effect has been shown to help fuel wildfires in the Rocky Mountains in the US in a 2006 study led by Anthony Westerling of Scripps Institution of Oceanography in California, US (Science, vol 313, p 888).

Baltzer found that early springs in Siberia were linked to the Arctic Oscillation, an atmospheric phenomenon similar to the El Niño Southern Oscillation in the Pacific Ocean.

He and his colleagues had previously shown that forest fires in Siberia were similarly linked to this phenomenon. His latest research suggests that years of high Arctic Oscillation activity tend to be characterised by early springs, as well high forest fire activity.

Swirling vortex

The Arctic Oscillation governs how fast storms circle around the North Pole, but Baltzer cautions that this is simply a correlation -- the vortex does not necessarily cause the fires and the snowmelt.

"What is likely is that the Arctic Oscillation Index is an indicator of large scale climate change," he told New Scientist. "Imagine molecules in a bottle. As the bottle heats up, the molecules move faster."

In November 2006, a team led by James Randerson of the University of California at Irvine in the US showed that forest fires in high latitudes tend to cool the local climate in the long-term.

But Baltzer says this does not necessarily mean Siberia will undergo a negative feedback loop, where global warming will cause forest fires which will in turn result in cooling, and return the ecosystem to normal. He cautions that such reasoning does not take into account the other effects of global warming on forests. For instance, modelling studies have suggested that forests will move towards the poles as a result of climate change.

Journal reference: Journal of Climate (DOI:10.1175/JCLI4226).

Link to article: http://www.newscientist.com/article/dn12394-early-springs-show-siberia-is-warming-fast.html

John Turner et al., By the end of the century we expect one third of Antarctic sea ice to disappear as ozone hole closes

BLOGGER'S NOTE: This is probably one of my most favorite subjects -- the vortices!

Why Antarctic ice is growing despite global warming

by Catherine Brahic, New Scientist, April 20, 2009

It's the southern ozone hole whatdunit. That's why Antarctic sea ice is growing while at the other pole, Arctic ice is shrinking at record rates. It seems CFCs and other ozone-depleting chemicals have given the South Pole respite from global warming.

Winds circle clockwise around Antarctica, whip off Victoria Land and create a vortex of cold storms (dark blue) off the Ross Sea, where sea ice is expanding. The vortex also draws in warm (red) air from South America, which warms the Antarctic Peninsula (Image: modified from Turner/AGU) -- Please click on the graphic to enlarge the details.

But only temporarily. According to John Turner of the British Antarctic Survey, the effect will last roughly another decade before Antarctic sea ice starts to decline as well.

Arctic sea ice is decreasing dramatically and reached a record low in 2007. But satellite images studied by Turner and his colleagues show that Antarctic sea ice is increasing in every month of the year except January. "By the end of the century we expect one third of Antarctic sea ice to disappear," says Turner. "So we're trying to understand why it's increasing now, at a time of global warming."

In a new study, Turner and colleagues show how the ozone hole has changed weather patterns around Antarctica. These changes have drawn in warm air over the Antarctic Peninsula in West Antarctica and cooled the air above East Antarctica.

The Southern Ocean is home to some of the strongest ocean winds on the planet. The region between 40° and 60° South is well-known to sailors who call it the "roaring forties" and "furious fifties."

Wind vortex

If the South Pole were smack in the middle of Antarctica, the winds would circle neatly around it in a clockwise direction. But in fact the continent is set slightly off-centre relative to the South Pole. As a result, the winds whip off Victoria Land and create a vortex over the Southern Ocean north of the Ross Sea (see blue area in figure). Turner compares this to the way wind going down a line of buildings will whip into a vortex when it comes to a corner.

The vortex generates a large area of storm activity. It also draws in warm air from South America over the Antarctic Peninsula, making this the warmest region of the continent.

By running an atmospheric computer model with and without the ozone hole, Turner and his colleagues found that the depletion of the ozone has intensified the winds of the roaring forties and furious fifties. The net result has been to draw more warm air in from Chile – which has warmed the Antarctic peninsula and caused the collapse of several ice shelves – and generate stronger cool-air storms around the Ross Sea.

Satellite data shows that sea ice has shrunk west of the Antarctic Peninsula and grown in the Ross Sea. Because the increase in sea ice extent has been greater than the reduction around the Antarctic peninsula, the net effect is that since the ozone hole appeared 30 years ago, Antarctic ice has grown. The researchers say their models suggest this is most likely a result of the ozone hole, although they cannot rule out the possibility that natural variations in sea ice extent have also played a role.

Ozone healing

"Over the next 50 to 100 years, the ozone hole will heal," says Turner. "At the same time, greenhouse gases will rise. In next decade or so we should see sea ice plateauing and then decreasing massively if greenhouse gases continue to increase."

Earlier this year, research led by Eric Steig of the University of Washington, Seattle, showed that although the Antarctic continent as a whole has warmed by 0.5 °C in the last 50 years – on a par with the global average – the figure hides strong regional differences. West Antarctica has warmed while temperatures over East Antarctica have dropped.

Accordingly, the disintegration of large ice shelves have all been in West Antarctica, the most famous example being the Larsen ice shelf. More recently, scientists have been anxiously expecting the Wilkins ice shelf to collapse as well.

Journal reference: Geophysical Research Letters (DOI: 10.1029/2009GL037524, in press).

Link to article: http://www.newscientist.com/article/dn16988-why-antarctic-ice-is-growing-despite-global-warming.html

Fred Pearce: Arctic meltdown is a threat to humanity (methane emission, melting permafrost, thermokarst lakes, methane hydrates)

Arctic meltdown is a threat to humanity

by Fred Pearce, environmental correspondent, New Scientist, Issue 2701, March 25, 2009

I am shocked, truly shocked," says Katey Walter, an ecologist at the University of Alaska in Fairbanks. "I was in Siberia a few weeks ago, and I am now just back in from the field in Alaska. The permafrost is melting fast all over the Arctic, lakes are forming everywhere and methane is bubbling up out of them."

The permafrost is melting fast all over the Arctic, lakes are forming everywhere and methane is bubbling out of them

Back in 2006, in a paper in Nature, Walter warned that as the permafrost in Siberia melted, growing methane emissions could accelerate climate change. But even she was not expecting such a rapid change. "Lakes in Siberia are five times bigger than when I measured them in 2006. It's unprecedented. This is a global event now, and the inertia for more permafrost melt is increasing."

No summer ice

The dramatic changes in the Arctic Ocean have often been in the news in the past two years. There has been a huge increase in the amount of sea ice melting each summer, and some are now predicting that as early as 2030 there will be no summer ice in the Arctic at all.

Discussions about the consequences of the vanishing ice usually focus either on the opening up of new frontiers for shipping and mineral exploitation, or on the plight of polar bears, which rely on sea ice for hunting. The bigger picture has got much less attention: a warmer Arctic will change the entire planet, and some of the potential consequences are nothing short of catastrophic.

Changes in ocean currents, for instance, could disrupt the Asian monsoon, and nearly two billion people rely on those rains to grow their food. As if that wasn't bad enough, it is also possible that positive feedback from the release of methane from melting permafrost could lead to runaway warming.

Runaway warming

The danger is that if too much methane is released, the world will get hotter no matter how drastically we slash our greenhouse gas emissions. Recent studies suggest that emissions from melting permafrost could be far greater than once thought. And, although it is too early to be sure, some suspect this scenario is already starting to unfold: after remaining static for the past decade, methane levels have begun to rise again, and the source could be Arctic permafrost.

What is certain is that the Arctic is warming faster than any other place on Earth. While the average global temperature has risen by less than 1 °C over the past three decades, there has been warming over much of the Arctic Ocean of around 3 °C. In some areas where the ice has been lost, temperatures have risen by 5 °C.

This intense warming is not confined to the Arctic Ocean. It extends south, deep into the land masses of Siberia, Alaska, Canada, Greenland and Scandinavia, and to their snowfields, ice sheets and permafrost. In 2007, the North American Arctic was more than 2 °C warmer than the average for 1951 to 1980, and parts of Siberia over 3 °C warmer. In 2008, most of Siberia was 2 °C warmer than average (see map).

Positive feedbacks

Most of this is the result of positive feedbacks (see illustration) from lost ocean ice, says David Lawrence of the National Center for Atmospheric Research in Boulder, Colorado. His modelling studies show that during periods of rapid sea-ice loss, warming extends some 1500 kilometres inland from the ice itself. "If sea-ice continues to contract rapidly over the next several years, Arctic land warming and permafrost thaw are likely to accelerate," he says.

Changes in wind patterns may accelerate the warming even further. "Loss of summer sea ice means more heat is absorbed in the ocean, which is given back to the atmosphere in early winter, which changes the wind patterns, which favours additional sea ice loss," says James Overland, an oceanographer at the Pacific Marine Environmental Laboratory in Seattle. "The potential big deal is that we now may be having a positive feedback between atmospheric wind patterns and continued loss of sea ice."

Incidentally, the changing winds might also be to blame for some of the cold and snowy weather in North America and China in recent winters, Overland says. Unusual poleward flows of warm air over Siberia have displaced cold air southwards on either side.

Going global

The rapid warming in the Arctic means that a global temperature rise of 3 °C, likely this century, could translate into a 10 °C warming in the far north. Permafrost hundreds of metres deep will be at risk of thawing out.

This is where things go global. The Arctic is not just a reflective mirror that is cracking up. It is also a massive store of carbon and methane, locked into the frozen soils and buried in icy structures beneath the ocean bed.

A quarter of the land surface of the northern hemisphere contains permafrost, permanently frozen soil, water and rock. In places, deep permafrost that formed during the last ice age, when the sea level was much lower, extends far out under the ocean, beneath the seabed. Large areas of permafrost are already starting to melt, resulting in rapid erosion, buckled highways and pipelines, collapsing buildings and "drunken" forests.

Locked away

The real worry, though, is that permafrost contains organic carbon in the form of long-dead plants and animals. Some of it, including the odd mammoth, has remained frozen for tens of thousands of years. When the permafrost melts, much of this carbon is likely to be released into the atmosphere.

No one knows for sure how much carbon is locked away in permafrost, but it seems there is much more than we thought. An international study headed by Edward Schuur of the University of Florida last year doubled previous estimates of the carbon content of permafrost to about 1600 billion tonnes -- roughly a third of all the carbon in the world's soils and twice as much as is in the atmosphere.

Time bomb

Schuur estimates that 100 billion tonnes of this carbon could be released by thawing this century, based on standard scenarios. If that all emerged in the form of methane, it would have a warming effect equivalent to 270 years of carbon dioxide emissions at current levels. "It's a kind of slow-motion time bomb," he says.

One hotspot is the 40,000-year-old east Siberian permafrost region. It alone contains 500 billion tonnes of carbon, says Philippe Ciais, co-chair of the Global Carbon Project, a research network analysing the carbon cycle. East Siberia was at times 7 °C warmer than normal during the summer of 2007, he says.

Higher temperatures mean the seasonal melting of the upper layer of soil extends down deeper than normal, melting the permafrost below. Microbes can then break down any organic matter in the thawing layer, not only releasing carbon but also generating heat that leads to even deeper melting. The heat produced by decomposition is yet another positive feedback that will accelerate melting, Ciais says.

Potent greenhouse gas

What's more, if summer melting depth exceeds the winter refreezing level then a layer of permanently unfrozen soil known as a talik forms, sandwiched between the permafrost below and the winter-freezing surface layer. "A talik allows heat to build more quickly in the soil, hastening the long-term thaw of permafrost," says Lawrence.

The carbon in melting permafrost can enter the atmosphere either as carbon dioxide or methane, which is a far more potent greenhouse gas, molecule-for-molecule. If organic matter decomposes in the low-oxygen conditions typical of the boggy soils and lakes in these regions, more methane forms.

Researchers have been monitoring the Stordalen mire in northern Sweden for decades. The permafrost there is melting fast and, as conditions become wetter, it is releasing ever more methane into the air, says Torben Christensen of Lund University in Sweden. This is the future for most of the northern hemisphere's permafrost, he says.

Disturbing picture

It's not just existing boggy patches that are the problem. In low-lying areas, the loss of volume as ice-rich permafrost melts leads to the collapse of the ground and the formation of thermokarst lakes from the meltwater. Satellite surveys show the number and area of these lakes is increasing and, as the work by Walter and others shows, they could be a major source of methane.

Put together, the latest research paints a disturbing picture. Since existing models do not include feedback effects such as the heat generated by decomposition, the permafrost could melt far faster than generally thought. "Instead of disappearing in 500 years, the deepest permafrost could disappear in 100 years," Ciais says.

The permafrost is not the only source of methane in the Arctic. Shallow ocean sediments can be rich in methane hydrates, a form of ice containing trapped methane. Particularly worrying are the huge amounts of methane hydrate thought to lie beneath the Arctic Ocean. Because the waters here are so cold, methane hydrates can be found closer to the surface than in most other parts of the world. These shallow deposits are far more vulnerable to the warming of surface waters.

Blowouts

Juergen Mienert at the University of Tromso in Norway, who has analysed past eruptions of methane hydrates from the Arctic, says current conditions are disturbingly similar to those in the past when warming waters penetrated sediments, triggering the release of hydrates. "Global warming will cause more blowouts, more releases," he says.

While shrinking sea ice in 2007 may have attracted all the headlines, some researchers say what is really scaring them is a simultaneous jump in methane levels. While the level of methane in the atmosphere has more than doubled since pre-industrial times, for the past decade or so there has been little change.

Then, in 2007, several million tonnes of extra methane mysteriously entered the atmosphere. Detailed analysis from methane monitors around the world suggests that much of it came from the far north. Ciais says it looks like the biggest source was Siberian permafrost.

Unstoppable

This is still contentious. Matt Rigby of the Center for Global Change Science at the Massachusetts Institute of Technology, who has analysed the methane surge, says we cannot yet say whether emissions from melting permafrost contributed most to the rise. "But 2007 was unusually warm in Siberia, and we would expect emissions increases when temperature rises," he adds.

The rise could just be a blip -- or the start of something big. "Once this process starts, it could soon become unstoppable," Ciais says.

Walter agrees. Right now, she estimates, only a few tens of millions of tonnes of methane are being emitted. "But there are tens of billions of tonnes potentially available for release." And the faster the warming, the faster the emissions will rise.

Out of control

Most worrying of all is the risk of a runaway greenhouse effect. The carbon stored in the far north has the potential to raise global temperatures by 10 °C or more. If global warming leads to the release of more greenhouse gases, these releases will cause yet more warming and still more carbon will escape to the atmosphere. Eventually the feedback process would continue even if we cut our greenhouse emissions to zero. At that point climate change would be out of control.

There is another concern about Arctic melting: the growing amount of fresh water flowing into the Arctic Ocean. The shrinking thickness and extent of sea ice has added a huge amount of fresh water already. Meanwhile, rivers are pouring up to 10% more water into the ocean than they did half a century ago. This is partly the result of rising precipitation as the air warms -- warmer air can hold more moisture -- and partly the result of melting permafrost, ice and snow. Yet more fresh water is coming from the melting of the Greenland ice sheet. As the Arctic warms further, these flows of fresh water will increase.

All this extra fresh water could weaken the pump that drives the thermohaline circulation, or ocean conveyor current. Its most famous element is the Gulf Stream in the North Atlantic, but the conveyor travels all the oceans. It has its beginnings in the far north of the Atlantic, off Greenland, where unusually dense water plunges to the ocean floor. The water becomes dense here partly because it cools and partly because the formation of sea ice increases salinity. As the water gets a bit warmer and a bit less salty, thanks to all the extra fresh water, the worry is that the pump could slow down.

Fears that the conveyor will soon shut down altogether, causing a fall in temperatures in northern Europe, have receded. Models of the climate system do not predict a shutdown any time within the next century, says oceanographer Stefan Rahmstorf of the Potsdam Institute for Climate Impact Research in Germany.

Monsoon warning

Even a slowdown in the conveyor could produce dramatic changes, though. Climate models suggest that changes in the ocean conveyor will alter rainfall patterns around the world. The models are backed by studies of how the climate has changed during past shutdowns of the ocean conveyor.

The biggest consequence, says Buwen Dong of the Walker Institute for Climate System Research at the University of Reading, UK, is likely to be a disruption, and quite probably a complete collapse, of the Asian monsoon, causing severe droughts in south Asia. "It could have enormous social and economic impacts on these nations," he says.

The disruption of the monsoon would have enormous social and economic impacts in south Asia

You can say that again. The Asian monsoon is the main source of water for large areas of the most heavily populated continent. An estimated 2 billion -- getting on for 1 in 3 citizens on the planet -- rely on it to grow their food. Take away the monsoon and they would starve. All because of warming in the Arctic.

Unquantifiable

Nobody can be sure how likely all this is. Indeed, the scientists at the Intergovermental Panel on Climate Change (IPCC) who compile its reports cannot even reach agreement on how to quantify the probabilities of such events. As a result, the "scary scenarios" were barely mentioned in the last report.

Nonetheless, the latest findings suggest we cannot afford to ignore these possibilities, especially given that everything to do with global climate is linked. The loss of Arctic sea ice could lead to the release of ever more methane from permafrost and methane hydrates. That in turn would make a dramatic reduction in the strength of the ocean conveyor sometime this century increasingly likely, which could lead to abrupt changes in the Asian monsoon.

With the summer sea ice in the Arctic Ocean already shrinking much faster than the IPCC models predicted, one thing is for sure. It is not just the polar bears who should be worrying about the warming Arctic.

Link to article: http://www.newscientist.com/article/mg20127011.500-arctic-meltdown-is-a-threat-to-humanity.html

NSIDC experts present new research on Arctic amplification at the AGU Fall Conference

15–19 December 2008

NSIDC experts present new research at American Geophysical Union (AGU) Fall Conference

NSIDC experts presented posters and oral presentations on new research concerning changing permafrost, Arctic amplification, the international challenges that come with loss of Arctic sea ice, and more in December 2008 at the AGU conference. Please contact the NSIDC Press Office for more information about the presentations or speakers highlighted below: +1 (303) 492-1497 or srenfrow@nsidc.org.

We offered information on new and updated data sets and tools, data resources for cryospheric and Earth science researchers, and information for journalists, educators, and the general public at our booth number 2052.

Climate, Permafrost, and Landscape Interactions on the Tibetan Plateau (Tingjun Zhang, NSIDC Senior Research Scientist, invited oral presentation GC11B-02)

Observational records show that climate warming has been underway on the Qinghai-Tibetan Plateau in China for the past few decades. Our preliminary findings suggest that local land-cover/land-use change and human activities may substantially contribute to the observed climate warming on the Plateau, with subsequent impacts on permafrost and climate feedbacks.

Arctic Sea Ice in 2008: Standing on the Threshold (Mark Serreze, NSIDC Director Elect and Senior Research Scientist, invited oral presentation U24B-01)

Perhaps the most visible sign of global climate change is the Arctic's rapidly shrinking sea ice cover. Concerns are growing that we are approaching a “tipping point,” beyond which there is rapid transition to an ice-free Arctic Ocean in summer. Sea ice extent in September 2007 was the lowest recorded over the satellite era, and likely the lowest in at least a century. Could summer 2007 have been the tipping point? And what was the significance of the second-lowest extent set in September 2008?

Estimating Terrestrial Wood Biomass from Observed Concentrations of Atmospheric Carbon Dioxide (Kevin Schaefer, NSIDC Research Scientist, poster presentation B33A-0399)

Biomass harvesting, fires, and other disturbances lead to a long-term net sink of atmospheric carbon dioxide from biomass. However, because of a lack of global observations, most terrestrial carbon cycle models assume that biomass is in a steady state. Using a terrestrial carbon cycle model and an atmospheric transport model, we estimate global maps of wood biomass consistent with observed atmospheric carbon dioxide concentrations.

Emerging Arctic Amplification as Seen in the NCEP/NCAR Reanalysis (Julienne Stroeve, NSIDC Research Scientist, poster presentation C41B-0502)

Rises in surface air temperature in response to increasing atmospheric greenhouse gas concentrations will be larger in the Arctic compared to the Northern Hemisphere as a whole. This concept is known as Arctic amplification; models indicate that Arctic amplification will be focused over the Arctic Ocean. Recent observations of conditions over the Arctic Ocean are consistent with model-projected Arctic amplification associated with declining sea ice, suggesting that we may be seeing the emergence of Arctic amplification.

A Reconstructed 1784–2007 Time Series of Greenland Melt Extent (Oliver Frauenfeld, NSIDC Research Scientist, oral presentation C44A-08)

Total melt on the Greenland ice sheet has been rising over the past several decades, with 2007 melt extent setting a new record. We developed a reconstructed history of annual Greenland melt extent from the late 1700s to 2007 using relationships between historical temperature/circulation observations and ice melt. This reconstruction puts 2007 into a historical perspective. The reconstruction indicates that if the current trend toward increasing melt extent continues, total melt across the Greenland ice sheet will exceed historic values of the past two and a quarter centuries.

Impacts of Declining Arctic Sea Ice: An International Challenge (Mark Serreze, NSIDC Director Elect and Senior Research Scientist, invited oral presentation C51B-01)

Recognition is growing that ice loss will have environmental impacts that may extend well beyond the Arctic. What are the major national and international research efforts focusing on the multifaceted problem of declining sea ice? What are the areas of intersection, and what is the state of collaboration? How could national and international collaboration be improved? This talk will review some of these issues.

Synoptic-scale Atmospheric Forcing of Frozen Ground in the Eurasian High Latitudes (Oliver Frauenfeld, NSIDC Research Scientist, oral presentation C52A-04)

Seasonal freezing and thawing of frozen ground plays an important role in ecosystem diversity, productivity, and the Arctic hydrologic system. Long-term changes in seasonal freeze and thaw depths are useful indicators of climate change, but previous assessments only looked at data from 1956 to 1990. Here, we update the assessment through 2000 to include a decade that experienced accelerated climate warming. We find a statistically significant overall change in seasonal freeze depth. We also note that a prominent decrease in freeze depths from 1970 to 1995 appears tied to the North Atlantic Oscillation.

Arctic atmospheric circulation and surface air temperature anomalies: Are the rules changing? (Andy Barrett, NSIDC Research Scientist, oral presentation C53A-07)

Relationships between atmospheric circulation and temperature in the Arctic appear to be changing. The past five years have seen record or near-record sea ice lows and strong positive temperature anomalies over the Arctic Ocean in autumn. We compare recent and past autumns that have similar atmospheric circulation patterns to gain insight into emerging Arctic amplification.

Link to NSIDC webpage: http://nsidc.org/news/events/agu_2008/

The Great Frost of 1709, the Winter of 2009, and the Polar Vortex

The Great Frost of 1709, the Winter of 2009, and the Polar Vortex

February 11, 2009

Dear Readers,

Some of the most popular articles posted recently on this blog have been about the 1709 Great Frost in Europe. That article came from New Scientist (click here and hit the page-down key twice). If you read it closely, you will notice that it mentions that the normal cause of cold weather in western European winters are the winds coming from Siberia and blowing toward the west, but in the winter of 1709, the winds were coming from the west and the south.

"The most immediate cause of cold winters in Europe is usually an icy wind from Siberia. 'What you would expect would be long runs of easterly winds with a well-developed anticyclone over Scandinavia sucking in cold air from Siberia,' says Wheeler. Instead, his data show a predominance of southerly and westerly winds -- which would normally bring warm air to Europe. 'There were only occasional and easterlies and those were never for more than a few days,' says Wheeler. Another odd finding was that January was unusually stormy. Winter storms tend to bring milder, if wilder, weather to Europe. 'This combination of cold, storms and westerlies suggests some other mechanism was responsible for that winter.' "

Right now, western Europe is again experiencing very cold and stormy weather (although, I dare say that once in a while this is to be expected in the winter, is it not?). Are there any similarities between now and 300 years ago?

Well, maybe.

NASA's Earth Observatory has posted an interesting report (click here and hit the page-down key twice) on the stratospheric conditions over the Arctic from January 10 through February 4. During that time, the polar vortex split into two vortices (click here to see the still graphic representations), and these vortices were consequently at slightly lower latitudes, spinning in counter-clockwise directions, thus pulling winds across northern Europe from the west.

[The animation of the splitting of the polar vortex is really fascinating. NASA's Earth Observatory has posted an animation that shows the changes in temperature in the stratosphere, going up to about 20 kilometers. What it shows is perhaps disturbing. But who really knows? The satellites have not been up there all that long observing. But to my simple eyes, it looks like our planet coughed out a bunch of really hot air straight up over the Arctic. Notice that temperatures start out in the -88 °C range, and by the time they finish, they have gone up to 12 °C -- and we are talking about the stratosphere here! not the surface. OK, so here is the link to the QuickTime animation -- it is well worth waiting for it to download. Note, also, that on occasion, the servers at NASA appear to be overloaded, so you may not always be able to get into the link, but keep trying.]

The New Scientist article points out that although there were three very large volcanic eruptions during the end of the Little Ice Age (a regional phenomenon, not a real ice age), the summer of 1707 was extremely hot, despite a solar minimum.

"...the 1690s saw a string of cold summers and failed harvests, while the summer of 1707 was so hot people died from heat exhaustion. Overall, the climate was colder, with the sun's output at its lowest for millennia. There were some spectacular volcanic eruptions in 1707 and 1708, including Mount Fuji in Japan and Santorini and Vesuvius in Europe. These would have sent dust high into the atmosphere, forming a veil over Europe. Such dust veils normally lead to cooler summers and sometimes warmer winters, but climatologists think that during this persistent cold phase, dust may have depressed both summer and winter temperatures."

I think we all remember that 2007 was an extremely hot year, and consequently the sea ice at the North Pole melted in a dramatic fashion.

But it would be a real stretch to try to say that that makes current conditions similar to those of 300 years ago.

And, these past few years, we have been having something of a solar minimum, too, but I doubt we can make any hay out of that, either.

No, the main thing to note, in my opinion, are not the similarities, but the fact that this year the planet appeared to belch out the excess heat that had accumulated at latitudes further south, when it moved north and appeared to blast through the vortex and split it.

OK, this is the first time that I have tried to embed a video, so let's see if this works: QuickTime video of stratospheric temperatures and the polar vortex splitting in two.

And, all I can say about that is that I hope that this manuever really got rid of some of the excess heat, thereby improving the Earth's energy imbalance. Does anyone have any thoughts on this? Would love to hear from you.

p.s. Oh, yeah, and before I forget, wasn't it in January that while temperatures in Europe and the U.S. were so low, the temperatures in the Arctic were so high that Arctic sea ice growth just about ground to a complete halt?

NSIDC (Click here and hit page-down key twice):

"...January 15 to 26, ice extent saw essentially no increase; an unusual wind pattern appears to have been the cause."

And, have a look at the truly sad state of the ice on January 23, 2009 (click here for the image). In fact, I just looked at today's Envisat image, and the sea ice to the north of Ellesmere Island and Greenland actually looks worse than it did on the 23rd.

NASA's Earth Observatory: Stratosphere Influences Winter Weather, January 10 - February 2, 2009

NASA's Earth Observatory: Stratosphere Influences Winter Weather, January 10 February 6, 2009

Stratospheric temperatures over the Arctic, January 10 (left) February 6 (right), 2009.


Polar vortex. Left: January 10, 2009. Right: February 6, 2009.

BLOGGER'S NOTE: It is well worth downloading this file to watch the incredibly high temperatures that occurred at an altitude of 30 km over the Artic in late January and early February (they went from 88 °C to +12 °C). Quicktime animation of polar stratospheric temperatures and vortex (THE LINK HAS BEEN REPAIRED): http://earthobservatory.nasa.gov/images/imagerecords/36000/36972/npole_gmao_200901-02.mov

NASA, February 7, 2009 – Winter turned fierce in the opening weeks of 2009. A bitter cold snap set in over much of the United States, and temperatures plummeted beyond –30 °C (–22 °F) in parts of the Upper Midwest. On February 2, portions of Western Europe were doused with heavy snow. England received the brunt of the storm with up to 20 centimeters (8 inches) of snow falling in London. It was the heaviest snowfall southeastern England had seen in nearly 20 years, reported BBC News. So why all the nasty weather? Part of the answer lies in the stratosphere, some 20 kilometers (12 miles) above the Earth’s surface.

Starting in January and extending into early February 2009, wind and temperature patterns in the stratosphere changed dramatically. In just a few weeks, temperatures climbed by about 50 °C (90 °F) on average, with larger spikes in places, and winds flipped direction, changing by nearly 100 meters per second (200 m.p.h.). That change influenced weather patterns lower in the atmosphere. These images and the associated animation show how the stratosphere changed and help illustrate why the United States and Europe were in the grip of such odd weather. The still figures show temperatures (top) and vorticity (bottom) on January 10 (left) and February 2 (right). The images are based on assimilated weather observations of the atmosphere from the Goddard Modeling and Assimilation Office at NASA Goddard Space Flight Center.

In the winter, little to no sunlight reaches Earth’s northern extremes. Deprived of energy, the stratosphere over the Arctic grows cold. These were the conditions present on January 10, 2009, as shown in the top left image. The cold air mass creates a low-pressure system that sits over the Arctic throughout the winter. Farther south, where the Sun is shining, the air is warmer and air pressure is higher. Air flows away from the high-pressure system towards the low-pressure system. Because the Earth is turning, the air is deflected to the right as it moves north, creating a strong counterclockwise (west to east) current of wind which scientists call the polar night jet.

The lower pair of images represent the air mass or polar vortex that controls the wind pattern. Essentially, the winds are strongest at the edge of the polar vortex (where the pressure difference between the air masses is greatest). The area of red in the lower left image represents polar air that typically sits over the Arctic during January. In general, strong winds circle the red regions, or areas of high vorticity, in a counterclockwise direction. These winds, moving at speeds well above 100 miles per hour, influence winds and weather patterns closer to Earth’s surface. Their influence means that weather in England and Western Europe typically comes from the west. Over England, western winds blow in ocean air warmed by the Atlantic Gulf Stream.

The big change in the Arctic came when the polar vortex ripped apart. A developing weather system in the lower atmosphere traveled upward into the stratosphere. The disturbance nudged into the center of the Arctic air mass, elongating it and eventually splitting it like a cell in mitosis. By February 2, two air masses existed, each with a jet of wind circling it counterclockwise as depicted in the lower right image.

Warm air filled the gap between the two colder air masses, and temperatures high over the North Pole climbed, as shown in the upper right. Now the colder air had shifted farther south over Canada and Siberia. Over North America, this piece of the stratospheric polar vortex had a deep reach into the lower atmosphere (troposphere), which created strong winds from the north that carried cold Arctic air far south into the United States.

In Europe, the split in the air mass actually changed the direction of winds in the lower atmosphere. The second piece of the polar vortex was centered east of Western Europe, as shown in the lower left image, and it too was surrounded by a jet of strong wind moving counterclockwise. Like the segment of the polar vortex over North America, this piece of the polar vortex also had a deep reach into the lower atmosphere. It caused cold continental air to blow in from the east, replacing the warmer air that typically blows in from the west. As the frigid air moved over the North Sea, it picked up moisture, which fell over the United Kingdom and parts of France as heavy snow.

Data provided by the Goddard Modeling and Assimilation Office, courtesy of Paul Newman. Caption by Holli Riebeek with information provided by Paul Newman.

BLOGGER'S NOTE: Link (sometimes, especially on the weekends, the server at NASA just can't handle the volume, but keep trying, you will get there from here!): http://earthobservatory.nasa.gov/IOTD/view.php?id=36972