Showing posts with label GrIS. Show all posts

John Cook, John Wahr: Greenland ice mass loss through August 2010

Greenland ice mass loss after the 2010 summer

by John Cook, Skeptical Science, November 1, 2010
The National Oceanic and Atmospheric Administration (NOAA) recently released the Arctic Report Card. The report contains a wealth of information about the state of climate in the Arctic circle (mostly disturbing). Especially noteworthy is the news that in 2010, Greenland temperatures were the hottest on record. It also experienced record setting ice loss by melting. This ice loss is reflected in the latest data from the GRACE satellites which measure the change in gravity around the Greenland ice sheet (H/T to Tenney Naumer from Climate Change: The Next Generation and Dr. John Wahr for granting permission to repost the latest data).
 
Figure 1. Greenland ice mass anomaly - deviation from the average ice mass over the 2002 to 2010 period. Note: this doesn't mean the ice sheet was gaining ice before 2006 but that ice mass was above the 2002 to 2010 average. (John Wahr)
The ice sheet has been steadily losing ice and the rate of ice loss has doubled over the 8-year period since gravity measurements began. The accelerating ice loss is independently confirmed by GPS measurements of uplifting bedrock. The GRACE data gives us an insight into why Greenland is losing ice mass at such an accelerating rate -- ice loss has spread from the south east all the way up the west coast:
 
Figure 2. Rate of mass change from Greenland over 2003-2007 and 2003-2010 periods. Mass loss rate has spread up the north western ice margin over the last few years. (John Wahr) 

Greenland's supra-glacial lakes to be studied by Penn State group led by Derrick Lampkin

'Supra-glacial lakes' are the focus of a new Penn State study

February 11, 2010 'Supra-glacial lakes' are the focus of a new Penn State study
Image of subglacial lake in the midst of the ice. Photo: Derrick Lampkin, Penn State

(PhysOrg.com) -- Rising temperatures on the Greenland ice sheet cause the creation of large surface lakes called supra-glacial lakes. Now a Penn State geographer will investigate why these lakes form and their implications.

NASA awarded Derrick Lampkin, assistant professor of geography, almost $300,000 over three years to look at these lakes.

"Learning where lakes are, how they form, and how that changes through the melt season can help us really understand a lot about important processes that control how the Greenland ice sheet responds to warming," Lampkin said.

Supra-glacial lakes form when melting water collects in pools in the lower levels of the ice sheet in melt or ablation zones. These lakes drain rapidly through cracks in the ice channeling water to beneath the ice sheet, affecting how ice sheets move and how pieces calve off into the ocean.

Researchers assumed that the influence of basal structure -- the structure under the ice at the base -- controls where lakes form on the surface, but the magnitude and degree of this influence are not well known, according to Lampkin. It is important to determine how surface processes and basal conditions interact to shape the topography.

Lampkin's work will complement other research by glaciologists at Penn State, such as Richard Alley and Sridhar Anandakrishan, in understanding how ice sheets work and contribute to . He will look at a variety of existing information, including altimeter data, to create . He will model the temperatures under the ice and, using existing ice-penetrating radar data, create the basal topography. He will also look at ten years' worth of high-resolution LandSat images to map lake features.

"This is an exciting time for the study of the world of ice, but unfortunately the public is not always aware of why this type of work is important," Lampkin said.

In an effort to involve the public in the investigation of ice sheets, Lampkin has proposed an outreach program to create Facebook and iPhone applications that will allow users to map the locations of supra-glacial lakes using high-resolution satellite imagery.

The Facebook and iPhone applications will present users with pre-selected satellite imagery and a tutorial on how to spot the supra-glacial lakes. Lampkin said users who map the locations could receive some sort of incentive through points or rewards for another Facebook game.

According to Lampkin, it is important to track the development of the supra-glacial lakes, because they form and drain quickly. More people mapping these lakes will give researchers more data to learn about them. In addition, if members of the public are able to map the lakes, they might feel they have a personal stake in the study of climate change science.

"The more the public is involved and informed, the more they will understand how climate science is conducted and may be more willing to support these research efforts," he said. Additionally, participation of this type may be the very spark to encourage a young mind to one day become an ice scientist.

Provided by Pennsylvania State University.

Link:  http://www.physorg.com/news185121767.html

Dr Richard Alley puts paid to wmar's ridiculous industry-bought-and-paid-for pseudoscience on Dot Earth

Reality check on old ice, climate and CO2


Richard Alley’s name has been thrown around a bit by bloggers asserting that ice-core records from Greenland show  that carbon dioxide has scant, if any, influence on climate. Dr. Alley, a glaciologist and climate scientist at Penn State, is a longtime contributor to the Intergovernmental Panel on Climate Change, author of a nice history of ice and climate, “ The Two-Mile Time Machine,” and — as many Dot Earth readers are aware — a teacher with musical and terpsichorean talents (see the YouTube video below for his orbital dance explaining how ice-age cycles help show the amplifying power of greenhouse gases).
There have been repeated references to his work here by skeptics of human-driven warming, most notably by “wmar.” Here’s an example (link to full comment is here):
The ice tells us about the past, and from Dr. Alley of the I.P.C.C., it is entirely clear that the carbon/temperature link is either a fallacy or negligible. Unlike the I.P.C.C. or any such pro AGW group, the ice cores have no emotions or agendas and simply are what they are … let’s have a look shall we?
WattsUpWithThat…
I sent a query to Dr. Alley about such interpretations of his work and the ice-core record and he sent a reply, the heart of which is pasted below. Where he refers to  GISP2, he’s describing a particular ice core extracted during what was called “Greenland Ice Sheet Project 2.”
First off, no single temperature record from anywhere can prove or disprove global warming, because the temperature is a local record, and one site is not the whole world. One of the lessons drawn from comparing Greenland to Antarctica and many other places is that some of the temperature changes (the ice-age cycling) are very widespread and shared among most records, but other of the temperature changes (sometimes called millennial, or abrupt, or Younger-Dryas-type) are antiphased between Greenland and the south, and still other temperature changes may be unrelated between different places (one anomalously cold year in Greenland does not tell you the temperature anomaly in Australia or Peru). After scientists have done the hard work of working out these relations, it is possible to use one ice-core record to represent broader regions IF you restrict consideration to the parts that are widely coherent, so it is O.K. to plot a smoothed version of an Antarctic temperature record against CO2 over long times and discuss the relation as if it is global, but a lot of background is required.
Second, although the central Greenland ice-core records may provide the best paleoclimatic temperature records available, multiple parameters confirm the strong temperature signal, and multiple cores confirm the widespread nature of the signal, the data still contain a lot of noise over short times (snowdrifts are real, among other things). An isotopic record from one site is not purely a temperature record at that site, so care is required to interpret the signal and not the noise. An extensive scientific literature exists on this topic, and I believe we are pretty good in the community at properly qualifying our statements to accord with the underlying scientific literature; the blogospheric misuses of the GISP2 isotopic data that I have seen are not doing so, and are making errors of interpretation as a result.

Thirdly, demonstration that there have been large climate changes in the past without humans in no way demonstrates that humans are not now responsible. Many people have died naturally but murder still exists; it is up to the police to learn whether a given mortality was natural or not, and up to climate science to learn what is causing ongoing changes (and we have good confidence that most of what is happening to climatic global average surface temperature is being caused by humanity now). Similarly, demonstration that life, and humans, survived warmer temperatures in the past in no way shows that warmer temperatures in the future are good for us. If you don’t care about humans and other things with us here, making a big change in climate might be an interesting experiment. Evolution does respond to climate change and produce novel results. I just happen to have a personal bias (shared, I believe, by the majority of the six-plus billion people on the planet) that we should ask what is best for humanity, and pursue that. An opinion, surely, and not purely scientific, but that’s my bias.
So, what do we get from GISP2? Alone, not an immense amount. With the other Greenland ice cores (which demonstrate that the GISP2 record is quite good and reproducible), and compared to additional records from elsewhere, an immense amount.
> More sunshine from orbital changes produces warming. The magnitude looks consistent with our understanding of the climate system.

>
Some of the “wiggles” in temperature (such as the Little Ice Age signal) correlate with changes in solar output. The beryllium-10 record provides an imperfect but useful estimate of the past variations of solar output, after correction for effects of magnetic-field variation on beryllium-10 production. The resulting solar fluctuations have been small over the times of good climate records, with small climate response, as expected. Again, there is no solid evidence for any weirdness, special sensitivity of climate to the sun, or large solar variations, but instead a generally good match to expected behavior of the climate system. (I’m among those who have looked very hard to find weirdness, too.)
> Nothing else really weird appears in forcings of climate change. No major changes are found in space dust, which remains rare enough that it cannot have been very important. Large changes in cosmic rays are documented in response to magnetic-field variations (the Laschamp event of about 40,000 years ago is especially prominent) with no corresponding change in climate, so any cosmic-ray influence on the climate must be very small (a weak correlation can be obscured by noise; a strong control is almost always visible “by eye,” and clearly is absent). Volcanic eruptions and local climate response are recorded, and again appear consistent with expectations of climate science. There may be small but interesting time-variations in eruptions, but the record is almost entirely one of “noise”–if volcanoes could get organized they could be very important agents of climate change, but they aren’t organized. (The recent work of Huybers and Langmuir suggests that on ice-age time scales, the loading and unloading of the planet by ice growth/shrinkage and sea-level fall/rise may weakly organize the volcanoes, but not a lot, and with nothing interesting for our time.)
Climate is surely a lot of things. The data show that the sun’s variations have been small over the times we care about, the climate responds to variations in sunshine caused by orbital changes, but these are slow. CO2 matters a lot. Volcanoes make “noise.” With those in your pocket, you’re a long way to understanding changes in Earth’s climate—not done, but well on your way.
The abrupt-climate-change story remains interesting, though. Today, the salty north Atlantic waters sink before they freeze in the winter. The data indicate that at times in the past, the north Atlantic was fresher so the waters froze before they sank. The resulting wintertime cooling in the north Atlantic was rather severe, and the influences far from the north Atlantic included a general southward shift of the tropical circulations and drying of monsoonal and northern-tropical regions where billions now live. The IPCC gives >90% chance that the melting of Greenland’s ice and other changes in the future will not be fast enough to trigger such a discontinuity over the next century, but >90% is not necessarily 100%. The implications, that slowing down or stopping the melting may buy insurance against a rare but catastrophic outcome, are interesting.
So, using GISP2 data to argue against global warming is, well, stupid, or misguided, or misled, or something, but surely not scientifically sensible. And, using GISP2 data within the larger picture of climate science demonstrates that our scientific understanding is good, supports our expectation of global warming, but raises the small-chance-of-big-problem issue that in turn influences the discussion of optimal human response.
 Link:  http://dotearth.blogs.nytimes.com/2010/02/08/richard-alley-on-old-ice-climate-and-co2/

S. B. Luthcke et al., 2009 Fall AGU, Greenland ice sheet (GrIS) mass changes (through July 25, 2009) from NASA/GSFC GRACE Mascon solutions


Greenland Ice Sheet Mass Changes from NASA GSFC GRACE Mascon Solutions

S. B. Luthcke, D. D. Rowlands, J. J. McCarthy, A. Arendt, T. Sabaka, J. P. Boy, F. G. Lemoine, "Recent Changes of the Earth's Land Ice from GRACE," presented at 2009 Fall AGU, H13G-02 (693337), Dec. 14, 2009.

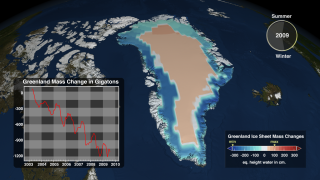
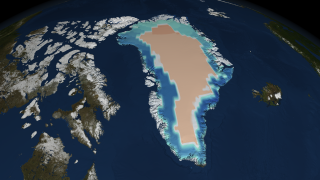
The mass changes of the Greenland Ice Sheet (GrIS) are computed from the Gravity Recovery and Climate Experiment (GRACE) inter-satellite range-rate observations for the period April 5, 2003, through July 25, 2009. The mass of the GrIS has been computed at 10-day intervals and 200-km spatial resolution from a regional high-resolution mascon solution (Luthcke and others, 2008 and 2006). The animation shows the change in mass referenced from April 5, 2003. The spatial variation in surface mass is shown in centimeters equivalent height of water. The time variation of the GrIS mass is shown in the x-y plot insert with units of gigatons.

∗Corresponding author: Scott B. Luthcke, NASA GSFC, Planetary Geodynamics Laboratory, Code 698.
e-mail: Scott.B.Luthcke@nasa.gov; Tel. (301) 614-6112.

This animation shows mass changes over Greenland  with a colorbar, graph and clock overlay.    This animation shows mass changes over Greenland with a colorbar, graph and clock overlay.
Duration: 49.0 seconds
Available formats:
  1280x720 (30 fps) MPEG-4   20 MB
  640x360 (30 fps) MPEG-4   4 MB
  1920x1080 (60 fps) Frames (Composite)
  1920x1080 (30 fps) Frames (Composite)
  1280x720 (60 fps) Frames (Composite)
  1280x720 (30 fps) Frames (Composite)
  320x180     PNG           217 KB
  160x80       PNG           58 KB
  80x40         PNG           16 KB
How to play our movies


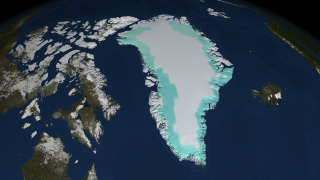
This animation shows mass changes over Greenland without the chart, colorbar or seasonal clock.    This animation shows mass changes over Greenland without the chart, colorbar or seasonal clock.
Duration: 49.0 seconds
Available formats:
  1280x720 (30 fps) MPEG-4   22 MB
  640x360 (30 fps) MPEG-4   4 MB
  1920x1080 (60 fps) Frames (Background)
  1920x1080 (30 fps) Frames (Background)
  1280x720 (60 fps) Frames (Background)
  1280x720 (30 fps) Frames (Background)
  320x180     PNG           254 KB
How to play our movies


Overlay of the graph, clock and colorbar with an alpha channel.    Overlay of the graph, clock and colorbar with an alpha channel.

Available formats:
  320x180     PNG           24 KB
  1920x1080 (60 fps) Frames (Overlay)
  1920x1080 (30 fps) Frames (Overlay)
  1280x720 (60 fps) Frames (Overlay)
  1280x720 (30 fps) Frames (Overlay)
How to play our movies


A high resolution still image of ice sheet mass changes over Greenland on 07/25/2005.    A high resolution still image of ice sheet mass changes over Greenland on 07/25/2005.

Available formats:
  6400 x 3600     TIFF 22 MB
  320 x 180         PNG     262 KB


A high resolution still image of ice sheet mass changes over Greenland on 07/25/2009.    A high resolution still image of ice sheet mass changes over Greenland on 07/25/2009.

Available formats:
  6400 x 3600     TIFF 22 MB
  320 x 180         PNG     263 KB


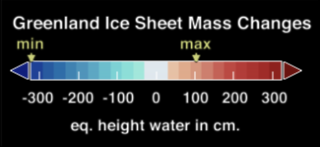
This colorbar used for the above animation.  The minimum data value is -322.933 while the maximum data value is 101.653.    This colorbar used for the above animation. The minimum data value is -322.933 while the maximum data value is 101.653.

Available formats:
  325 x 150         TIFF     58 KB
  320 x 147         PNG       58 KB

Animation Number:3663
Completed:2009-12-04
Animators:Cindy Starr (GST) (Lead)
Lori Perkins (NASA/GSFC)
Producer:Paul Reddish (Free Spirit Films)
Scientist:Scott Luthcke (NASA/GSFC)
Platforms/Sensors/Data Sets:Terra and Aqua/MODIS/Blue Marble: Next Generation
Gravity Recovery and Climate Experiment (GRACE)/mascon solution (4/5/2003 - 7/25/2009)
Series:GRACE MASCON Solutions

Science paper:Luthcke, S. B., A. A. Arendt, D. D. Rowlands, J. J. McCarthy and C.F. Larsen. Recent glacier mass changes in the Gulf of Alaska region from GRACE mascon solutions. Journal of Glaciology, Vol. 54, No. 188, 2008. Luthcke, S. B., H. J. Zwally, W. Abdalati, D. D. Rowlands, R. D. Ray, R. S. Nerem, F. G. Lemoine, J. J. McCarthy and D. S. Chinn. Recent Greenland ice mass loss by drainage system from satellite gravity observations. Science, 314, 1286, 2006. [DOI: 10.1126/science.1130776]
Please give credit for this item to: NASA/Goddard Space Flight Center Scientific Visualization Studio.
The Blue Marble data is courtesy of Reto Stockli (NASA/GSFC).
Link to this page: http://svs.gsfc.nasa.gov/vis/a000000/a003600/a003663/

Recent Changes of the Earth's land ice from GRACE: methods, signals and errors, Scott Luthcke et al., AGU Fall Meeting, San Francisco, December 2009: Abstract H13G-02 (693337)

AGU Fall Meeting, San Francisco, December 2009

Session B.3-b: Cryosphere
 
 
First Author and presenter: Scott Luthcke

Co-Authors: D. D. Rowlands, J. J. McCarthy, T. Sabaka, F. G. Lemoine, and J. P. Boy

Abstract 

The NASA/DLR Gravity Recovery and Climate Experiment (GRACE) mission has been acquiring ultra-precise inter-satellite K-band range and range-rate (KBRR) measurements providing new observations of the complex evolution of the Earth's land ice. The fidelity of the ice mass flux solutions depends on many factors including solution method, parameterization and processing of the GRACE level 1B data including forward modeling of various non-ice mass signals (e.g. hydrology, oceans, atmosphere). In this talk we present the latest GRACE derived ice mass solutions for the Gulf of Alaska glaciers, Greenland and Antarctica. We compare solutions derived from various solution techniques and explore the impact of forward modeling and parameterization on the final solutions. Solution results as well as errors and limitations will be discussed.

Konrad Steffen, Swiss Camp update through 2008: Increased runoff from melt from the Greenland Ice Sheet

The pdf file is here (sorry, I have no way to copy the graph -- lots of great graphs and topographic graphics on the ice sheet):

http://hmg.npolar.no/opencms/export/sites/hmg/en/documents/topic-1/Steffen_topic1.pdf

NOAA: 2009 Arctic Report Card for Greenland

Dear Readers,

I don't know what's up with Greenland, but it is very difficult to find the numbers for the 2008-2009 mass balance loss. The report below, in the last figure, gives only two-dimensional figures for loss of some of the outlet glaciers. Maybe they are waiting for the meeting of the AGU in December or for later in November before Copenhagen -- I sure am not privy to the reasons for this lack of information.


NOAA's 2009 Arctic Report Card for Greenland

J. E. Box, L.-S. Bai, R. Benson, I. Bhattacharya, D. H. Bromwich (Byrd Polar Research Center, The Ohio State University, Columbus, OH, U.S.A.) J. Cappelen (Danish Meteorological Institute, Copenhagen, Denmark), D. Decker (Byrd Polar Research Center, The Ohio State University, Columbus, OH, U.S.A.), N. DiGirolamo (Science Systems Applications Inc. and NASA Goddard Space Flight Center, Greenbelt, MD, U.S.A.), X. Fettweis (Department of Geography, University of Liège, Liège, Belgium), D. Hall (NASA Goddard Space Flight Center, Greenbelt, MD, U.S.A.), E. Hanna (Department of Geography, University of Sheffield, U.K.), T. Mote (Department of Geography, University of Georgia, Atlanta, GA, U.S.A.), M. Tedesco (Department of Earth and Atmospheric Sciences, City College of New York, New York, NY, U.S.A.), and R. van de Wal and M. van den Broeke (Institute for Marine and Atmospheric Research Utrecht, Utrecht University, Utrecht, The Netherlands)
October 19, 2009
Summary

An abnormally cold winter across the southern half of Greenland led to substantially higher west coast sea ice thickness and concentration. Even so, record-setting summer temperatures around Greenland, combined with an intense melt season (particularly across the northern ice sheet), led the 2008 Greenland climate to be marked by continued ice sheet mass deficit and marine-terminating ice disintegration.

Regional surface temperatures 

Temperature anomalies were mixed and exhibited seasonal variability (Fig. 5.17). Annual mean temperatures for the whole ice sheet were +0.9 °C, but were not abnormal, given a rank of 23 of 51 years over the 1958-2008 period (Box et al. 2006). Persistent warm anomalies were evident over the northern ice sheet in all seasons. Temperatures were abnormally cold over the southern ice sheet in winter. Coastal meteorological stations around Greenland with a consistent 51-yr period (1958-2008) (Cappelen 2009) indicate a record-setting warm summer in 2008. The Upernavik (Nuuk) summer temperature was the warmest (second warmest) on record since 1873, respectively.
winter near-surface air temperature anomalies summer near-surface air temperature anomalies

Figure G1. (a) winter and (b) summer near-surface (2 m) air temperature anomalies with respect to the 1971–2000 base period, simulated by Polar MM5 after Box et al. (2006). (Click each image for larger version)

Table G1. 2008 Summer 700-hPa temperature and winter precipitation anomalies (relative to 1948–2008 NCEP reanalysis means) for glaciated regions of the Arctic (excluding Greenland). Inferred sign of surface mass balance is based on comparison of historical mass balance records for each region with NCECEP reanalysis temperature and precipitation anomalies. Anomalies in melt duration and the timing of melt onset and freeze-up (relative to 2000–2004 climatology) derived from QuikSCAT data. For timing, negative anomalies indicate an earlier-than-normal date.
Table with summer 2008 temperature, precipitation anomalies

Upper-air temperatures 

Upper-air sounding data available from the Integrated Global Radiosonde Archive (Durre et al. 2006) indicate a continued pattern of lower tropospheric warming and lower stratospheric cooling 1964-onward (Box and Cohen 2006). Lower tropospheric warm anomalies in all seasons, particularly in spring along western Greenland, were accompanied by relatively small midtropospheric cool anomalies. Winter tropopause temperatures (200 hPa) were above normal. Lower stratospheric (above 100 hPa) temperatures were lower than normal.

Surface melt extent and duration

Passive (SMMR and SSM/I, 1979–2008) and active (QuikSCAT, 2000–08) microwave remote sensing (Bhattacharya et al. 2009, submitted to Geophys. Res. Lett.; Liu et al. 2005) indicate abnormally high melt duration over the north and northeast ice sheet and along the east and west coasts above Greenland’s most productive three outlet glaciers in terms of ice discharge into the sea: Kangerlussuaq, Helheim and Jakobshavn (Fig. G2). Lower-than-normal melt duration is evident over much of the upper elevations of the ice sheet. New records of the number of melting days were observed over the northern ice sheet, where melting lasted up to 18 days longer than previous maximum values. Anomalies near the west coast are characterized by melting up to 5–10 days longer than the average (Tedesco et al. 2008).
2008 Greenland ice sheet surface melt duration anomalies based on SSM/I 2008 Greenland ice sheet surface melt duration anomalies based on QuikSCAT

Figure G2. 2008 Greenland ice sheet surface melt duration anomalies relative to the 1989–2008 base period based on (a) SSM/I and (b) QuikSCAT (2000–08 base period), after Bhattacharya et al. (2009, submitted to Geophys. Res. Lett.). (Click each image for larger version)

The average daily melt extent, after Mote and Anderson (1995) and Mote (2007), for 2008 was 424,000 km2, about 2.4% greater than the 1989–2008 average of 414,000 km2, representing the lowest average melt extent since 2001. Significantly more melt occurred in 2008 in the northeast (45.6% greater than the 1989–2008 average) and northwest (29.7%), but less occurred in the two east-central regions (−16.8% and −25.4%) and in the southeast (−21.1%). Melt extent in 2008 was also above the 1979–2007 average. The trend in the total area of melt during 1979–2008 is approximately +15,900 km2 yr−1 and is significant at the 95% confidence interval (p < 0.01).

Precipitation anomalies

Annual PT anomalies in 2008, determined using Polar MM5 data assimilation modeling (Bromwich et al. 2001, Cassano et al. 2001, Box et al. 2006), were positive (negative) up to 750 mm (−250 mm) over the eastern (western) ice sheet, respectively. More PT than normal occurred in isolated areas in extreme southeast, east, north, and northwestern Greenland. The overall anomaly indicated approximately 41 Gt more PT than normal for the 1971–2000 standard normal period.

Surface albedo

Melt season (day 92–274) surface albedo anomalies, derived using the Liang et al. (2005) algorithm applied to daily cloud-free MODIS imagery, indicate a lower surface albedo around the ablation zone (except the east ice sheet) (Fig. G3) resulting from the combined effect of the positive summer surface melt intensity anomaly and, in most areas, less winter snow coverage. A positive albedo anomaly is evident for the ice sheet accumulation zone and is consistent with above-average solid precipitation and/or less-than-normal melting/snow grain metamorphism.
Surface albedo anomaly Jun-Jul 2008

2008 surface mass balance anomalies


Figure G3. Surface albedo anomaly Jun–Jul 2008 relative to a Jun–Jul 2000–08 base period. (Click image for larger version)

Figure G4. 2008 surface mass balance anomalies with respect to the 1971–2000 base period, simulated by Polar MM5 after Box et al. (2006). (Click image for larger version)
Surface mass balance

Polar MM5 climate data assimilation model runs spanning 51 years (1958–2008), calibrated by independent in situ ice-core observations (Bales et al. 2001, Mosley-Thompson et al. 2001, Hanna et al. 2006) and ablation stakes (van de Wal et al. 2006), indicate that 2008 total precipitation and net snow accumulation was slightly (6%–8%) above normal (Table G2). In accordance with a +0.9 °C 2008 annual mean surface temperature anomaly, the fraction of precipitation that fell as rain instead of snow, surface meltwater production, and meltwater runoff were 142%–186% of the 1971–2000 mean. Consequently, and despite 6%–9% (39–50 Gt) more snow accumulation than normal, the surface net mass balance was substantially (145 Gt) below normal. 2008 surface mass balance ranked ninth-least positive out of 51 years (1958–2008).

Table G2. Greenland ice sheet surface mass balance parameters: 2008 departures from 1971–2000 average (adapted from Box et al. 2006). Estimates by Hanna et al. (2008) are included for comparison.
Table with greenland ice sheet surface mass balance parameters

Surface mass balance anomalies indicate a pattern of increased marginal melting with noteworthy departures in excess of 1-m water equivalence per year from normal across the northern ice sheet (Fig. G4). The pattern of steepening mass balance profile is consistent with observations from satellite altimetry (Zwally et al. 2005) and airborne altimetry (Krabill et al. 2000), satellite gravity retrievals (e.g., Luthcke et al. 2006) and climate projections (Solomon et al. 2007).

Marine-terminating glacier area changes

Daily surveys of Greenland ice sheet marine terminating outlet glaciers from cloud-free MODIS imagery (http://bprc.osu.edu/MODIS/) indicate that the 34 widest glaciers collectively lost 106.4 km2 of marine-terminating ice between the end of summer 2008 and the end of summer 2009 (Figure G4). This is equivalent to an area 20% larger than Manhattan Island (87.5 km2), New York. The largest individual glacier losses are observed at: Humboldt (-37 km2); Zachariae Isstrom (-31 km2); and Midgard (-16 km2). The 2000-2009 rate (106 km2) has been linear (R = −0.98) despite the fact that a few individual glaciers exhibit erratic annual net ice area changes. The cumulative area change from end-of-summer 2000 to 2009 is −990 km2, an area 11.3 times that of Manhattan Island.
Cumulative annual area changes for 34 of the widest Greenland ice sheet marine-terminating outlets

Figure G4. Cumulative annual area changes for 34 of the widest Greenland ice sheet marine-terminating outlets.

Link to report on Greenland:  http://www.arctic.noaa.gov/reportcard/greenland.html

NOAA: Arctic Report Card -- Update for 2009

Dear Readers,

The post below is number 1,500 since this blog started in 2007.  Never in my wildest dreams could I have imagined that I would have posted so many articles here.  Nor could I have imagined that this blog would receive an average of nearly 500 visitors per day, with upwards of 800 pages per day viewed, now bringing total page views to nearly 200,000.

Over time, as the scientific articles have accumulated here, this blog has become a database for the advanced layperson seeking more knowledge of climate science.

I admit that I cannot nor do I try to cover all of the vast number of aspects of the science of climate change.  The blog's focus has been on the Arctic and on changing patterns of atmospheric and oceanic circulation all around the globe, although many other subjects are covered.

It is to be hoped that the blog's contents have been found useful by you, the reader.

I salute all of you for seeking the truth.

Sincerely,

Tenney Naumer

NOAA: Arctic Report Card -- Update for 2009


Warming of the Arctic continues to be widespread, and in some cases, dramatic.

Linkages between air, land, sea, and biology are evident.  


Link to first webpage here:  http://www.arctic.noaa.gov/reportcard/

Please click on the headings below to go to the various sections of the report.

Atmosphere
Large scale wind patterns impacted by loss of summer sea ice

There is evidence that, by creating a new major surface heat source, the recent extreme loss of summer sea ice extent is having a direct feedback effect on the general atmospheric circulation into the winter season (Francis et al., 2009). Fall air temperature anomalies of greater than +1.0 °C were observed well up into the atmosphere (Figure 3A), when averaged over 2003–2008 relative to a 1968–1996 base period. The higher temperatures in the lower troposphere decrease the atmospheric air density and raise the height of upper-air-constant-pressure levels over the Arctic Ocean (Figure 3B). These increased heights north of 75° N weaken the normal north-to-south pressure gradient that drives the normal west-to-east airflow in the upper troposphere. In this sense, the effect of higher air temperatures in the lower Arctic atmosphere is contributing to changes in the atmospheric circulation in both the Arctic and northern mid-latitudes. For example, Honda et al. (2009) suggest a remote connection between loss of Arctic sea ice and colder temperatures over eastern Asia.

The climate of the Arctic is influenced by repeating patterns of sea level pressure that can either dominate during individual months or represent the overall atmospheric circulation flow for an entire season. The main climate pattern for the Arctic is known as the Arctic Oscillation (AO) with anomalous winds that blow counter-clockwise around the pole when the pattern is in its positive phase. A second wind pattern has been more prevalent in the 21st century and is known as the Arctic Dipole (AD) pattern (Wu et al., 2006; Overland et al., 2008). The AD pattern has anomalous high pressure on the North American side of the Arctic and low SLP on the Eurasian side. This implies winds blowing more from south to north, compared to the AO, and increasing transport of heat into the central Arctic Ocean. The AD pattern occurred in all summer months of 2007 and helped support the major 2007 summer reduction in sea ice extent (Overland et al., 2008). Fall 2008 and winter/spring 2009 showed a return of the AO pattern, but also considerable month to month variability in the presence of these various climate patterns.

Sea Ice
Multi-year sea ice is being replaced by first year sea ice

Ocean
Upper ocean remains warm and less salty

Land
Increased runoff in Siberia, less snow in North America

Greenland
Ice sheet loss continues

Biology
High Arctic species impacted by loss of sea ice

Link to complete report (pdf file):  http://www.arctic.noaa.gov/reportcard/ArcticReportCard_full_report.pdf

Yarrow Axford et al., PNAS, Recent changes in a remote Arctic lake are unique within the past 200,000 years

Proceedings of the National Academy of Sciences, published online before print October 19, 2009; doi: 10.1073/pnas.0907094106

Recent changes in a remote Arctic lake are unique within the past 200,000 years

  1. Yarrow Axforda,1, Jason P. Brinerb, Colin A. Cookec, Donna R. Francisd, Neal Micheluttie, Gifford H. Millera,f, John P. Smole, Elizabeth K. Thomasb, Cheryl R. Wilsone and Alexander P. Wolfec

Abstract

The Arctic is currently undergoing dramatic environmental transformations, but it remains largely unknown how these changes compare with long-term natural variability. Here we present a lake sediment sequence from the Canadian Arctic that records warm periods of the past 200,000 years, including the 20th century. This record provides a perspective on recent changes in the Arctic and predates by approximately 80,000 years the oldest stratigraphically intact ice core recovered from the Greenland Ice Sheet. The early Holocene and the warmest part of the Last Interglacial (Marine Isotope Stage or MIS 5e) were the only periods of the past 200,000 years with summer temperatures comparable to or exceeding today's at this site. Paleoecological and geochemical data indicate that the past three interglacial periods were characterized by similar trajectories in temperature, lake biology, and lakewater pH, all of which tracked orbitally-driven solar insolation. In recent decades, however, the study site has deviated from this recurring natural pattern and has entered an environmental regime that is unique within the past 200 millennia.

Edited by Mark Brenner, University of Florida, Gainesville, FL, and accepted by the Editorial Board September 1, 2009 (received for review June 25, 2009) 

Link to abstract:  http://www.pnas.org/content/early/2009/10/16/0907094106.abstract

Jakobshavn Isbræ's floating tongue breaking up. Part II

Here is the MODIS Rapidfire image of the Jakobshavn Isbræ on September 13, 2009.  The tongue is broken.  Be sure to click on the photos to enlarge them and view them in more detail.


Below is an image from September 28, 2009.  The front of the tongue (tip?) is breaking up.  Note that this glacier moves (or the last reported speed) at a pace of only 17 km per year, so that tip of the tongue breaking had nothing to do with the break further in.


Also notice the greyish squiggle (I love that I can use non-scientific language in this blog) in the upper right -- that is the upstream ice stream deep into the the edge of the ice sheet.  Further, be aware that the beginning of the tongue starts much further back than the 2006 record.

Can anyone tell me if this is a normal thing that happens every year?  I don't think it is, but please correct me if I am wrong.

Sorry -- the images are not crystal clear due to the cloud cover hanging over that area.

UPDATE:  CLEAR IMAGES FROM OCTOBER 1, 2009:

Links to originals for the last two images (don't forget to click on them):

http://rapidfire.sci.gsfc.nasa.gov/realtime/single.php?2009274/crefl1_143.A2009274151500-2009274151959.250m.jpg

http://rapidfire.sci.gsfc.nasa.gov/realtime/single.php?2009274/crefl2_143.A2009274153500-2009274154000.250m.jpg

The Greenland ice sheet is shrinking

The Greenland ice sheet is shrinking


Satellite readings show Greenland is losing large quantities of ice. The enormous ice cap constituting the inland ice is melting at an ever-increasing rate, and there is every indication that the inland ice is contributing to the rise in sea level of the oceans.

An enormous net loss

Scientists are monitoring developments using satellites, light aircraft and observations on the ice, and most agree that global warming is the cause of this melting.

At the heart of the problem is the fact that ice formation occurring on the inland ice as a result of winter snowfalls cannot compensate for the melting. In other words, there is a net loss of ice. Calculations by a Dano–US team of scientists show an annual volume loss of about 257 km³.

The average net loss of ice in 2080 will have reached 465 km³ – a loss of ice 80% greater than today, research scientists of the International Arctic Research Center, Fairbanks, Alaska, state to Ritzau.

The melting is accelerating

A specific example of the situation is that twice as much ice melted in 2007 as was the case just three years earlier. In general, the region where there is increased melting has grown considerably in recent years. The melting has mainly occurred in the southern part of the inland ice and at the edges of the ice up to 3 km in height.

Glaciers are calving sooner

Readings show that the periphery of the inland ice is accelerating outwards. Therefore, the glaciers are calving sooner and more violently than before, and enormous icebergs are forming.

At the same time, the fronts of the largest glaciers are receding. This is due to a rise in summer temperatures. Only very little additional heat would be required for the snow covering large areas to disappear. A temperature increase of 1 °C distributed evenly across the large ice cap is enough to melt a vertical metre of ice each year. In other words, this would require one additional metre of ice to form from winter snowfalls in order to prevent the glacier from receding.

Measuring the ice

In the past, it was incredibly expensive and difficult to collect accurate information on the melting of the inland ice. In recent years, however, advanced satellites have made it possible to gather very accurate data, and a GPS network, GNET, positioned along the edge of the inland ice will provide data for use in calculations. GNET, which will be completed in 2010, is being established as a collaborative venture involving research scientists from the US, Luxembourg and Denmark.

GEUS is leading an ongoing monitoring programme (Programme for Monitoring of the Greenland Ice Sheet (PROMICE)that combines readings from GPS stations with data from aircraft and satellites to equip scientists to calculate the combined mass loss of the inland ice on an annual basis.

Meltwater in the sea

The inland ice is releasing increasing amounts of fresh water into the North Atlantic, which has a major impact on global ocean currents. This could have inherent consequences for the global climate, but no one knows exactly how or to what extent.

Professor Dorte Dahl-Jensen of the Niels Bohr Institute at the University of Copenhagen believes sea levels may rise by almost 1 m by the year 2100. The IPCC, the UN Intergovernmental Panel on Climate Change, is of the opinion that the maximum rise in sea level this century will probably be around 59 cm.

In Dorte Dahl-Jensen's opinion, the Panel on Climate Change has underestimated the melting of the inland ice. The Panel has first and foremost calculated the effect of melted sea ice. She expects 30 cm to come from the melting of the ice on Greenland and 30 cm from melting in Antarctica. The rest will come from small glaciers, and as a consequence of the water in the sea expanding as it warms.

Link to article:  http://climategreenland.com/klimaforandringer/indlandsisen_skrumper/&new_language=1

K. Delthloff et al.,The climate system of the Earth from a polar perspective

Nuuk Climate Days 2009: Changes of the Greenland Cryosphere Workshop & The Arctic Freshwater Budget International Symposium, Nuuk, Greenland, 25-27 August 2009


Primary author: DELTHLOFF, Klaus (Alfred Wegener Institute for Polar and Marine Research (AWI),
Germany), Klaus.Dethloff@awi.de.  Co-authors: RINKE, A. (Alfred Wegener Institute for Polar and Marine Research); HANDORF, D. (Alfred Wegener Institute for Polar and Marine Research); DORN, W. (Alfred Wegener Institute for Polar and Marine Research); BRAND, S. (Alfred Wegener Institute for Polar and Marine Research); MIELKE, M. (Alfred Wegener Institute for Polar and Marine Research); GRAESER, J (Alfred Wegener Institute for Polar and Marine Research); HERBER, A. (Alfred Wegener Institute for Polar and Marine Research)

Abstract ID: F1

The climate system of the Earth from a polar perspective


Balloon and radio sounding data from the North Pole drifting station NP35 for autumn 2007 to spring 2008 have been used to evaluate numerical model outputs (simulations with the regional climate model HIRHAM, ECMWF analyses). HIRHAM in the climate mode has some difficulty to represent the observed complex temperature profile, while the forecast mode shows better agreement. Sensitivity experiments concerning the atmospheric initial state, sea ice thickness and planetary boundary layer parameterization demonstrate improvements in the simulations.

Similar measurements have been carried out during spring 2009 on NP 36 and with the AWI airplane POLAR 5 over the Arctic Ocean. The pilot-project PAM-RCM (Pan-Arctic Measurements and Arctic Regional climate model simulations) provided a unique opportunity to obtain a snapshot of aerosol and cloud distributions and associated meteorological and atmospheric conditions as well as measurements of sea ice thickness in a latitude band between about 70°N and 80°N.

Sensitivity experiments using a coupled regional atmosphere-ocean-ice model of the Arctic has been conducted in order to identify the requirements needed to reproduce observed sea-ice conditions and to address uncertainties in the description of Arctic processes. While more sophisticated schemes for the albedo, the treatment of lateral freezing and melting, and the snow cover have been successfully introduced into the model, the parameterization of clouds is an open issue.

The global influence of Arctic feedbacks connected with sea-ice albedo changes and stratospheric ozone changes have been investigated. The simulations show significant changes over the Arctic and the whole globe due to changes of planetary wave patterns, which trigger the Arctic Oscillation (AO) and influences the sea -ice cover.

The impact of an interactive stratospheric ozone chemistry on the tropospheric circulation has been studied on the basis of the atmosphere-ocean-sea ice general circulation model ECHO-GiSP. The results show a sensitivity of the tropospheric circulation dynamics to the stratospheric chemistry. With enabled interactive stratospheric chemistry the model tends to the negative phase of the AO mode and a more unstable polar vortex..

Contact for symposium information:  Sune Nordentoft Lauritsen, e-mail: snl@space.dtu.dk

Greenland Ice Sheet’s elevation change in winter and atmospheric circulation

Nuuk Climate Days 2009 -- Changes of the Greenland Cryosphere Workshop & The Arctic Freshwater Budget International Symposium, Nuuk, Greenland, 25-27 August 2009

Primary author: CHEN, Linling (Nansen-Zhu International research center/Institute of Atmospheric Physics,
Chinese Academy of Sciences), lin-ling.chen@nersc.no ; Co-authors: JOHANNESSEN, Ola M. (Nansen Environmental and Remote Sensing Center); WANG, Huijun (Nansen-Zhu International research center/Institute of Atmospheric Physics, Chinese Academy of Sciences);  KHVOROSTOVSKY, Kirill (Nansen Environmental and Remote Sensing Center)

Abstract ID: F4
 

Greenland Ice Sheet’s elevation change in winter and atmospheric circulation

Data from ERS-1, ERS-2 and Envisat Satellites are analyzed to identify the relationship between winter elevation variations of Greenland ice sheet and sea level pressure during 1993-2007. It is found that the North Pacific oscillation and the North Atlantic oscillation, the two major teleconnection patterns of surface pressure fields in North Hemisphere, both have significant impacts on the Greenland ice sheet winter elevation change by influencing accumulation. In addition, we are evaluating modeled precipitation data over Greenland based on comparison with accumulation data from all available ice core records and meteorological station, in order to better understand how the atmospheric circulation impact the Greenland Ice Sheet’s Elevation.