The Jakobshavn Glacier in Greenland already flows so fast you can stand on a ridge above it and watch it move. In fact, it’s the fastest moving glacier on Earth, flowing from the land to the sea at more than 14 kilometers per year.
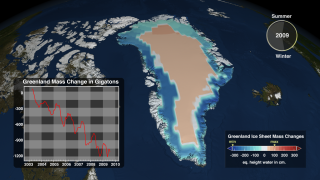
∗S. B. Luthcke, D. D. Rowlands, J. J. McCarthy, A. Arendt, T. Sabaka, J. P. Boy, F. G. Lemoine, "Recent Changes of the Earth's Land Ice from GRACE," presented at 2009 Fall AGU, H13G-02 (693337), Dec. 14, 2009. The mass changes of the Greenland Ice Sheet (GrIS) are computed from the Gravity Recovery and Climate Experiment (GRACE) inter-satellite range-rate observations for the period April 5, 2003, through July 25, 2009. The mass of the GrIS has been computed at 10-day intervals and 200-km spatial resolution from a regional high-resolution mascon solution (Luthcke and others, 2008 and 2006). The animation shows the change in mass referenced from April 5, 2003. The spatial variation in surface mass is shown in centimeters equivalent height of water. The time variation of the GrIS mass is shown in the x-y plot insert with units of gigatons. ∗Corresponding author: Scott B. Luthcke, NASA GSFC, Planetary Geodynamics Laboratory, Code 698. e-mail: Scott.B.Luthcke@nasa.gov; Tel. (301) 614-6112. | |||||||||||||||||||||||||||||
| This animation shows mass changes over Greenland with a colorbar, graph and clock overlay. Duration: 49.0 seconds Available formats: 1280x720 (30 fps) MPEG-4 20 MB 640x360 (30 fps) MPEG-4 4 MB 1920x1080 (60 fps) Frames (Composite) 1920x1080 (30 fps) Frames (Composite) 1280x720 (60 fps) Frames (Composite) 1280x720 (30 fps) Frames (Composite) 320x180 PNG 217 KB 160x80 PNG 58 KB 80x40 PNG 16 KB How to play our movies | |||||||||||||||||||||||||||||
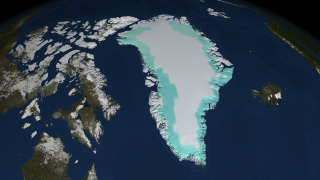
| This animation shows mass changes over Greenland without the chart, colorbar or seasonal clock. Duration: 49.0 seconds Available formats: 1280x720 (30 fps) MPEG-4 22 MB 640x360 (30 fps) MPEG-4 4 MB 1920x1080 (60 fps) Frames (Background) 1920x1080 (30 fps) Frames (Background) 1280x720 (60 fps) Frames (Background) 1280x720 (30 fps) Frames (Background) 320x180 PNG 254 KB How to play our movies | |||||||||||||||||||||||||||||
| Overlay of the graph, clock and colorbar with an alpha channel. Available formats: 320x180 PNG 24 KB 1920x1080 (60 fps) Frames (Overlay) 1920x1080 (30 fps) Frames (Overlay) 1280x720 (60 fps) Frames (Overlay) 1280x720 (30 fps) Frames (Overlay) How to play our movies | |||||||||||||||||||||||||||||
| A high resolution still image of ice sheet mass changes over Greenland on 07/25/2005. Available formats: 6400 x 3600 TIFF 22 MB 320 x 180 PNG 262 KB | |||||||||||||||||||||||||||||
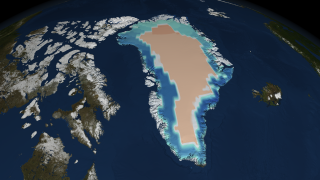
| A high resolution still image of ice sheet mass changes over Greenland on 07/25/2009. Available formats: 6400 x 3600 TIFF 22 MB 320 x 180 PNG 263 KB | |||||||||||||||||||||||||||||
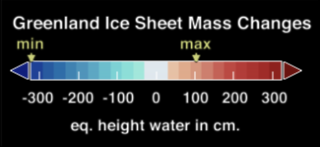
| This colorbar used for the above animation. The minimum data value is -322.933 while the maximum data value is 101.653. Available formats: 325 x 150 TIFF 58 KB 320 x 147 PNG 58 KB | |||||||||||||||||||||||||||||
| |||||||||||||||||||||||||||||
| by Richard Black, Environment correspondent, BBC News website, November 22, 2009 |
| Professor Richard Alley |
| |
| |
| The Grace satellites provide a twin eye on gravity at the Earth's surface |
by Richard Black, Environment correspondent, BBC News website, November 12, 2009 |
Professor Roger Barry |
The Grace satellites provide a twin eye on gravity at the Earth's surface |
Science (13 November 2009): Vol. 326, No. 5955, pp. 984-986; DOI: 10.1126/science.1178176 |
by Richard A. Kerr, ScienceNOW Daily News, 10 August 2009
Going down. Several centimeters' worth of water (pink) disappears each year from beneath the northern Indian subcontinent. Credit: Adapted from V. M. Tiwari et al., National Geophysical Research Institute.
Farming is a thirsty business on the Indian subcontinent. But how thirsty, exactly? For the first time, satellite remote sensing of a 2000-kilometer swath running from eastern Pakistan across northern India and into Bangladesh has put a solid number on how quickly the region is depleting its groundwater. The number "is big," says hydrologist James Famiglietti of the University of California, Irvine--big as in 54 cubic kilometers of groundwater lost per year from the world's most intensively irrigated region hosting 600 million people. "I don't think anybody knew how quickly it was being depleted over that large an area."The big picture of Indian groundwater comes from the Gravity Recovery and Climate Experiment (GRACE) satellite mission, launched in March 2002 as a joint effort by the U.S. National Aeronautics and Space Administration and the German Aerospace Center. Actually two satellites orbiting in tandem 220 kilometers apart, GRACE measures subtle variations in the pull of Earth's gravity by using microwaves to precisely gauge the changing distance between the two spacecraft.
As the lead spacecraft passes over a patch of anomalously strong gravity, it accelerates ahead of the trailing spacecraft. Once past the anomaly, the lead satellite slows back down. Then the trailing spacecraft accelerates and again closes on the leader. By making repeated passes over the same spot, GRACE measures changes in Earth's gravity, which are mainly due to water moving on and under the surface. Most famously, GRACE has recorded the shrinking of ice sheets; it has also detected shifting ocean currents, the desiccation of droughts, and the draining of large lakes.
Outside of wasting ice sheets, the world's largest broad-scale decline in gravity during GRACE's first 6 years came across a 2.7-million-square-kilometer, east-west swath centered on New Delhi. That's according to a study in press in Geophysical Research Letters by geophysicists Virendra Tiwari of the National Geophysical Research Institute in Hyderabad, India; John Wahr of the University of Colorado, Boulder; and Sean Swenson of the National Center for Atmospheric Research in Boulder. Adjusted for natural variations due to changing precipitation and evaporation, the decline in gravity that GRACE determined equates to a net loss of 54 plus or minus 9 cubic kilometers of groundwater per year, the group reports. That would produce a fall in the water table of about 10 centimeters per year averaged over the entire region.
A falling water table across the northern Indian subcontinent comes as no great surprise. The GRACE region of sharp groundwater depletion coincides with the world's most intensely irrigated land: Fifty percent to more than 75% of the land is equipped for irrigation with pumped groundwater or reservoir water. And then there are those 600 million people drawing heavily on groundwater. But, the group calculates, the GRACE-determined depletion rate implies that groundwater was being pumped out 70% faster in this decade than the Central Ground Water Board of India estimated it was in the mid-1990s. The apparent surge in withdrawal would have been large enough to turn a once-stable water table into a falling one that demands ever-deeper wells and bigger pumps and may draw in salty or polluted water.
GRACE "has shown us we can do a pretty reasonable job from space" gauging groundwater depletion, says Famiglietti. "We can help regional water managers by giving them a holistic view of a whole system." Still, across the subcontinent, no one knows how far down the water goes. They just know, as Famiglietti notes, that "it's not bottomless."
Link: http://sciencenow.sciencemag.org/cgi/content/full/2009/810/1
These “gravity anomaly” maps show where models of the Earth’s gravity field based on GRACE data differ from a simplified mathematical model that assumes the Earth is perfectly smooth and featureless. Areas colored yellow, orange, or red are areas where the actual gravity field is larger than the featureless-Earth model predicts—such as the Himalayan Mountains in Central Asia (top left of the left-hand globe)—while the progressively darker shades of blue indicate places where the gravity field is less—such as the area around Hudson Bay in Canada (top center of right-hand globe). The geoid is a hypothetical Earth surface that represents the mean sea level in the absence of winds, currents, and most tides. The geoid is a useful reference surface. It defines the horizontal everywhere and gravity acts perpendicular to it. A carpenter’s level aligns itself along the geoid and a carpenter’s plumb bob points down the vertical or perpendicular to the geoid. Water will not flow in aqueducts if the pipes are perfectly aligned along the geoid. Surveyors use knowledge of the geoid and the horizontal when they lay out highways and boundaries. Producing a precise model of the geoid has proven to be a challenge. Until recently, there was no single source for producing a geoid map. Data from several dozen satellites, along with surface measurements over land and from ships at sea, had to be combined to produce a model of the gravitational field. Traditionally, the models have done a fairly good job reproducing large-scale features of the gravity field, but have fallen short when it comes to reproducing finer-scale features or accurately describing time-variable gravity effects like those associated with the hydrologic cycle. GRACE provides, for the first time, global coverage of the Earth’s gravity field every 30 days from a single source. GRACE is already able to measure the gravity field with a level of precision that is at least 100 times greater than any existing measurement, and continued improvements are expected as the mission progresses. The finer details of the geoid that have evaded scientists for so long are on the verge of being revealed. GRACE also gives us our best opportunity to date to study time-variable gravity effects. As the mission progresses and more data are added to the model, the resolution of the geoid will improve even further.
| | ||
ScienceDaily, December 2, 2008 — Researchers at the Laboratoire d'Etudes en Géophysique et Océanographie Spatiales (1) (CNRS/Université Toulouse 3/CNES/IRD) and at a subsidiary of CNES (CLS) (2) have discovered that the accelerated melting of continental icepacks is the major reason for the rise in sea level over the 2003 to 2008 period, something which has minimized the effect of thermal expansion of seawater.
This question was resolved thanks to data from the French-American Satellite Jason-1, from two satellites of the GRACE space gravimetry mission and from the buoys of the Argo system. These results have been published online on the website of the journal Global and Planetary Change.
Between 1993 and 2003, the global mean sea level, measured very accurately by the French-American Topex/Poséidon satellites and their successor Jason-1, showed a relatively constant progression of 3 mm/yr. The last GIEC report, published in 2007, showed that more than half of this rise (approximately 1.5 mm/yr) was due to sea water expansion as it warmed up (steric contribution), while 1.2 mm/yr resulted from the reduction in mass of polar ice sheets and mountain glaciers. Since 2003 however, the situation has changed; a quite rapid rise (2.5 mm/yr) in sea water levels is still observed but, over the same period, the warming of the oceans is showing a plateau, only accounting for a rise of 0.4 mm/yr.
Thermal expansion was calculated using two independent methods:
Consequently, it is above all the increase in the mass of sea water rather than its heat content that is behind the rise in sea level that has been observed since 2003. The increase in the mass of the oceans is equivalent to a rise of 1.9 mm/yr of the mean sea level. What is the source of this extra water in the oceans? Melting continental ice sheets. Data from GRACE has made it possible to measure changes in the mass of the two polar ice sheets in Antarctica and Greenland. These were responsible for a 1 mm/yr increase in sea level (i.e. twice as much as in the previous decade). For mountain glaciers, the most recent estimates from glaciologists show a contribution of 1.1 mm/yr (also higher than during previous years).
Thus, losses from glacial masses can easily account for why the mass of sea water is increasing and are responsible for 80 % of the average rise in sea level in recent years. Given the accelerated melting of glaciers and polar ice sheets, if the steric contribution returned to the values of the 1990s, a rise in sea level of around 4 mm/yr could not be excluded.
Journal reference:
this blog learn to you all people in the world to keep our earth