Showing posts with label Arctic Ocean. Show all posts

T. Markus, J. C. Stroeve & J. Miller, JGR 114, Recent changes in Arctic sea ice melt onset, freezeup, and melt season length

Journal of Geophysical Research Oceans, 114 (2009) C12024; doi: 10.1029/2009JC005436.

Recent changes in Arctic sea ice melt onset, freezeup, and melt season length

Thorsten Markus (Cryospheric Sciences Branch, NASA Goddard Space Flight Center, Greenbelt, MD, U.S.A.), Julienne C. Stroeve (National Snow and Ice Data Center, University of Colorado, Boulder, CO, U.S.A.) and Jeffrey Miller (Wyle Information Sciences, NASA Goddard Space Flight Center, Greenbelt, MD, U.S.A.)

Abstract

In order to explore changes and trends in the timing of Arctic sea ice melt onset and freezeup, and therefore melt season length, we developed a method that obtains this information directly from satellite passive microwave data, creating a consistent data set from 1979 through present. We furthermore distinguish between early melt (the first day of the year when melt is detected) and the first day of continuous melt. A similar distinction is made for the freezeup. Using this method we analyze trends in melt onset and freezeup for 10 different Arctic regions. In all regions except for the Sea of Okhotsk, which shows a very slight and statistically insignificant positive trend (0.4 d decade−1), trends in melt onset are negative, i.e., toward earlier melt. The trends range from −1.0 d decade−1 for the Bering Sea to −7.3 d decade−1 for the East Greenland Sea. Except for the Sea of Okhotsk all areas also show a trend toward later autumn freeze onset. The Chukchi/Beaufort seas and Laptev/East Siberian seas observe the strongest trends with 7 d decade−1. For the entire Arctic, the melt season length has increased by about 20 days over the last 30 years. Largest trends of over 10 d decade−1 are seen for Hudson Bay, the East Greenland Sea, the Laptev/East Siberian seas, and the Chukchi/Beaufort seas. Those trends are statistically significant at the 99% level.

Received 13 April 2009; accepted 4 September 2009; published 29 December 2009.

Citation: Markus, T., J. C. Stroeve, and J. Miller (2009), Recent changes in Arctic sea ice melt onset, freezeup, and melt season length, J. Geophys. Res., 114, C12024; doi: 10.1029/2009JC005436.

Arctic Warming Overtakes 2,000 Years of Natural Cooling

Arctic Warming Overtakes 2,000 Years of Natural Cooling

National Center for Atmospheric Research, September 7, 2009


BOULDER,CO---Arctic temperatures in the 1990s reached their warmest level of any decade in at least 2,000 years, new research indicates. The study, which incorporates geologic records and computer simulations, provides new evidence that the Arctic would be cooling if not for greenhouse gas emissions that are overpowering natural climate patterns.

The international study, led by Northern Arizona University and the National Center for Atmospheric Research (NCAR), will be published in the September 4, 2009, edition of Science. It was primarily funded by the National Science Foundation, NCAR's sponsor.

The scientists reconstructed summer temperatures across the Arctic over the last 2,000 years by decade, extending a view of climate far beyond the 400 years of Arctic-wide records previously available at that level of detail. They found that thousands of years of gradual Arctic cooling, related to natural changes in Earth's orbit, would continue today if not for emissions of carbon dioxide and other greenhouse gases.

"This result is particularly important because the Arctic, perhaps more than any other region on Earth, is facing dramatic impacts from climate change," says NCAR scientist David Schneider, one of the co-authors. "This study provides us with a long-term record that reveals how greenhouse gases from human activities are overwhelming the Arctic's natural climate system."

Darrell Kaufman of Northern Arizona University, the lead author and head of the synthesis project, says the results indicate that recent warming is more anomalous than previously documented.

"Scientists have known for a while that the current period of warming was preceded by a long-term cooling trend," says Kaufman. "But our reconstruction quantifies the cooling with greater certainty than before."

Greenhouse gases overtake a natural cycle

The new study is the first to quantify a pervasive cooling across the Arctic on a decade-by-decade basis that is related to an approximately 21,000-year cyclical wobble in Earth's tilt relative to the Sun.  Over the last 7,000 years, the timing of Earth's closest pass by the Sun has shifted from September to January. This has gradually reduced the intensity of sunlight reaching the Arctic in summertime, when Earth is farther from the Sun.

The research team's temperature analysis shows that summer temperatures in the Arctic, in step with the reduced energy from the Sun, cooled at an average rate of about 0.2 °C (about 0.35 °F) per thousand years. The temperatures eventually bottomed out during the "Little Ice Age," a period of widespread cooling that lasted roughly from the 16th to the mid-19th centuries.

Even though the orbital cycle that produced the cooling continued, it was overwhelmed in the 20th century by human-induced warming.  The result was summer temperatures in the Arctic by the year 2000 that were about 1.4 °C (2.5 °F) higher than would have been expected from the continued cyclical cooling alone. 

"If it hadn't been for the increase in human-produced greenhouse gases, summer temperatures in the Arctic should have cooled gradually over the last century," says Bette Otto-Bliesner, an NCAR scientist who participated in the study.

Natural archives of Arctic climate

To reconstruct Arctic temperatures over the last 2,000 years, the study team incorporated three types of field-based data, each of which captured the response of a different component of the Arctic's climate system to changes in temperature.

These data included temperature reconstructions published by the study team earlier this year. The reconstructions were based on evidence provided by sediments from Arctic lakes, which yielded two kinds of clues: changes in the abundance of silica remnants left behind by algae, which reflect the length of the growing season, and the thickness of annually deposited sediment layers, which increases during warmer summers as deposits from glacial meltwater increase. 

The research also incorporated previously published data from glacial ice and tree rings that were calibrated against the instrumental temperature record. 

The scientists compared the temperatures inferred from the field-based data with simulations run with the Community Climate System Model, a computer model of global climate based at NCAR. The model's estimate of the reduction of seasonal sunlight in the Arctic and the resulting cooling was consistent with the analysis of the lake sediments and other natural archives. These results give scientists more confidence in computer projections of future Arctic temperatures. 

"This study provides a clear example of how increased greenhouse gases are now changing our climate, ending at least 2,000 years of Arctic cooling," says NCAR scientist Caspar Ammann, a co-author.

The new study follows previous work showing that temperatures over the last century warmed almost three times faster in the Arctic than elsewhere in the Northern Hemisphere.  This phenomenon, called Arctic amplification, occurs as highly reflective Arctic ice and snow melt away, allowing dark land and exposed ocean to absorb more sunlight.

"Because we know that the processes responsible for past Arctic amplification are still operating, we can anticipate that it will continue into the next century," says Gifford Miller of the University of Colorado at Boulder, a member of the study team. "Consequently, Arctic warming will continue to exceed temperature increases in the rest of the Northern Hemisphere, resulting in accelerated loss of land ice and an increased rate of sea level rise, with global consequences." 

The University Corporation for Atmospheric Research manages the National Center for Atmospheric Research under sponsorship by the National Science Foundation. Any opinions, findings and conclusions, or recommendations expressed in this publication are those of the author(s) and do not necessarily reflect the views of the National Science Foundation.


Link:   http://www.americantowns.com/co/boulder/news/arctic-warming-overtakes-2-000-years-of-natural-cooling-211451

Joseph Romm: Where on Earth is it unusually warm? Greenland and the Arctic Ocean, which is full of rotten ice


Where on Earth is it unusually warm? Greenland and the Arctic Ocean, which is full of rotten ice


New study supports finding that "the amount of [multi-year] sea ice in the northern hemisphere was the lowest on record in 2009"

by Joseph Romm, Climate Progress, January 6, 2010 Arctic warmth
Map of air temperature anomalies for December 2009, at roughly 3,000 feet above surface, Areas in orange and red are warm anomalies, areas in blue and purple are cool.
It’s cold here and in northern Eurasia, but it’s been positively toasty ar0und the Arctic circle — thanks to an extreme negative phase of the Arctic Oscillation, as the National Snow and Ice Data Center (NSIDC) explained in their online report yesterday.
The temperatures reported by NSIDC show some Arctic anomalies exceeding 7°C (13°F)!  That’s not good news for the kind of re-freezing one wants to see in the otherwise rapidly melting Greenland ice sheet (see Nature: “Dynamic thinning of Greenland and Antarctic ice-sheet ocean margins is more sensitive, pervasive, enduring and important than previously realized”).  It’s also one reason “December 2009 had the fourth-lowest average ice extent for the month since the beginning of satellite records, falling just above the extent for 2007. The linear rate of decline for December is now 3.3% per decade.”
Significantly, a new study, “Perennial pack ice in the southern Beaufort Sea was not as it appeared in the summer of 2009” by Barber et al. finds that all the crowing by the anti-science crowd about the supposed “recovery” of Arctic sea ice was quite premature:

In September 2009 we observed a much different sea icescape in the Southern Beaufort Sea than anticipated, based on remotely sensed products. Radarsat derived ice charts predicted 7 to 9 tenths multi-year (MY) or thick first-year (FY) sea ice throughout most of the Southern Beaufort Sea in the deep water of the Canada Basin. In situ observations found heavily decayed, very small remnant MY and FY floes interspersed with new ice between floes, in melt ponds, thaw holes and growing over negative freeboard older ice. This icescape contained approximately 25% open water, predominantly distributed in between floes or in thaw holes connected to the ocean below. Although this rotten ice regime was quite different that the expected MY regime in terms of ice volume and strength, their near-surface physical properties were found to be sufficiently alike that their radiometric and scattering characteristics were almost identical.
Yes, satellite (and other) measurements of Arctic sea ice extent were apparently deceived.   You might even say that an unfortunate trick of Nature helped hide the decline of Arctic ice:
This case of mistaken identity is physically explained by the factors which contribute to the return to Radarsat-1 from the two surfaces; both ice regimes had similar temperature and salinity profiles in the near-surface volume, both ice types existed with a similar amount of open water between and within the floes, and finally both ice regimes were overlain by similar, recently formed new sea ice in areas of negative freeboard and in open water areas. The fact that these two very different ice regimes could not be differentiated using Radarsat-1 data or in situ C-band scatterometer or microwave radiometer measurements, has significant implications for climate studies and for marine vessel navigation in the Canada Basin.
I had blogged on Barber’s work when it was first reported by Reuters in November (see “Arctic ice reaches historic seasonal low; “We are almost out of multiyear sea ice in the northern hemisphere”):
The multiyear ice covering the Arctic Ocean has effectively vanished….
“I would argue that, from a practical perspective, we almost have a seasonally ice-free Arctic now, because multiyear sea ice is the barrier to the use and development of the Arctic,” said Barber [Canada's Research Chair in Arctic System Science at the University of Manitoba].
Barber and his team thought they’d find “a huge multiyear ice pack that should have been in the Beaufort Sea” but
Instead, his ice breaker found hundreds of miles of what he called “rotten ice” — 50-cm (20-inch) thin layers of fresh ice covering small chunks of older ice.
“I’ve never seen anything like this in my 30 years of working in the high Arctic … it was very dramatic,” he said.
And now we have the Geophysical Research Letters paper by Barber et al., which concludes:
Our results are consistent with ice age estimates (Fowler and Maslanik, http://nsidc.org/news/press/20091005_minimumpr.html) that show the amount of MY sea ice in the northern hemisphere was the lowest on record in 2009 suggesting that MY sea ice continues to diminish rapidly in the Canada Basin even though 2009 areal extent increased over that of 2007 and 2008.
This study suggests that the Arctic continues to lose area — and, more importantly, volume — at a much more rapid pace than any major climate models had suggested.  I’ll end with this figure of mean monthly Ice Volume for the Arctic Ocean from a release by several scientific institutions:
Arctic Volume
I still like my odds on a 90% ice free Arctic by 2020 (see “Another big climate bet — Of Ice and Men“).  By then, I assume they’ll have figured out how to deal with Nature’s sea-ice-decline-hiding trick — or there will simply be too little ice for anybody to be fooled.
For more, see “Looking for Above Normal Temperatures? They are in the Arctic.
Related Posts:
Link: http://climateprogress.org/2010/01/06/science-nsidc-warm-greenland-arctic-rotten-ice-multi-year-arctic-oscillation/

B. J. Peterson et al., Science, 313(5790), Trajectory shifts in the Arctic and subarctic freshwater cycle

See also:  http://climatechangepsychology.blogspot.com/search?q=Sarafanov


Science (25 August 2006), Vol. 313, No. 5790, pp. 1061-1066; DOI: 10.1126/science.1122593

Review

Trajectory shifts in the Arctic and subarctic freshwater cycle

Bruce J. Peterson1,*, James McClelland2, Ruth Curry3, Robert M. Holmes4, John E. Walsh5 and Knut Aagaard6

Abstract

Manifold changes in the freshwater cycle of high-latitude lands and oceans have been reported in the past few years. A synthesis of these changes in freshwater sources and in ocean freshwater storage illustrates the complementary and synoptic temporal pattern and magnitude of these changes over the past 50 years. Increasing river discharge anomalies and excess net precipitation on the ocean contributed ~20,000 cubic kilometers of fresh water to the Arctic and high-latitude North Atlantic oceans from lows in the 1960s to highs in the 1990s. Sea ice attrition provided another ~15,000 cubic kilometers, and glacial melt added ~2000 cubic kilometers. The sum of anomalous inputs from these freshwater sources matched the amount and rate at which fresh water accumulated in the North Atlantic during much of the period from 1965 through 1995. The changes in freshwater inputs and ocean storage occurred in conjunction with the amplifying North Atlantic Oscillation and rising air temperatures. Fresh water may now be accumulating in the Arctic Ocean and will likely be exported southward if and when the North Atlantic Oscillation enters into a new high phase.

1 Ecosystems Center, Marine Biological Laboratory, Woods Hole, MA 02543, USA.
2 Marine Science Institute, University of Texas at Austin, Port Aransas, TX 78373, USA.
3 Woods Hole Oceanographic Institution, MS 21, Woods Hole, MA 02543, USA.
4 Woods Hole Research Center, 149 Woods Hole Road, Falmouth, MA 02540, USA.
5 International Arctic Research Center, 930 Koyukuk Drive, Post Office Box 75340, Fairbanks, AK 99775, USA.
6 Applied Physics Laboratory, University of Washington, 1013 NE 40th Street, Seattle, WA 98105, USA. 

 
*Correspondence e-mail: peterson@mbl.edu


Link to abstract:  https://www.sciencemag.org/cgi/content/abstract/313/5790/1061

M. M. Robinson, Stratigraphy (2009), New quantitative evidence of extreme warmth in the Pliocene Arctic

Stratigraphy, 6(4) (2009) 265-275.

New quantitative evidence of extreme warmth in the Pliocene Arctic

Marci M. Robinson* (U.S. Geological Survey, 926A National Center, Reston, VA 20192, U.S.A.)

Abstract

The most recent geologic interval characterized by warm temperatures similar to those projected for the end of this century occurred about 3.3-3.0 Ma, during the mid-Piacenzian Age of the Pliocene Epoch. Climate reconstructions of this warm period are integral to both understanding past warm climate equilibria and to predicting responses to today’s transient climate. The Arctic Ocean is of particular interest because in this region climate proxies are rare, and climate models struggle to predict climate sensitivity and the response of sea ice. In order to provide the first quantitative climate data from this region during this interval, sea surface temperatures (SST) were estimated from Ocean Drilling Program Sites 907 and 909 in the Nordic Seas and from Site 911 in the Arctic Ocean based on Mg/Ca of Neogloboquadrina pachyderma (sin) and alkenone unsaturation indices. Evidence of much warmer than modern conditions in the Arctic Ocean during the mid-Piacenzian with temperatures as high as 18 °C is presented. In addition, SST anomalies (mid-Piacenzian minus modern) increase with latitude across the North Atlantic and into the Arctic, extending and confirming a reduced mid-Piacenzian pole-to-equator temperature gradient. The agreement between proxies and with previously documented qualitative assessments of intense warming in this region corroborate a poleward transport of heat and an at least seasonally ice-free Arctic, conditions that may serve as a possible analog to future climate if the current rate of Arctic sea-ice reduction continues.

Introduction

Arctic Ocean surface waters and those of the surrounding seas have been warming since 1965, increasingly since 1995, even more rapidly since 2000, with 2007 and 2008 marking the first two sequential years of extreme summer minimum sea ice coverage (Comiso et al., 2008; Steele et al., 2008; Stroeve et al., 2008). In addition, autumn surface air temperatures during these two years were greater than 5 °C higher than the central Arctic average (Wang & Overland, 2009). Continuation of this trend could lead to a dramatic change in the Arctic ice-ocean-atmosphere regime (Johannessen et al., 1999). In anticipation of continued warming, climate model scenarios for the near future commonly feature Arctic warmth and sea ice retreat yet struggle to predict climate sensitivity and the response of sea ice in these high latitudes. In fact, model simulations of sea ice retreat compare poorly to observations (Stroeve et al., 2007), some underestimating sea ice minima by at least 30 years (Wang & Overland, 2009). Future projections of sea-ice cover vary wildly with some models simulating seasonal ice-free conditions by 2070 while others project virtually no change over the same period of time (Boe et al., 2009).

One way to refine climate models and to improve projections is to attempt to recreate known warm climates of the past from climate proxy data (Robinson et al., 2008a). A model’s ability to accurately portray a past climate state, both in terms of magnitude and spatial variability, increases confidence in climate projections based on that model. Due to the high sensitivity displayed by polar regions during the current warming trend, accurate reconstructions of paleo-conditions in high latitude regions during past warm intervals are integral to reliable model results, but data are rare due to the shortage of paleoclimate proxies in high latitudes, and high resolution temporal correlation between regions is complicated.

The most recent geologic interval of global warmth comparable to climate projections for the end of this century was ~3.3-3.0 Ma (IPCC 2007), during the mid-Piacenzian Age of the Pliocene Epoch. During this time interval, the positions of the continents and the patterns of oceanic circulation were similar to modern, but mean global temperatures were 2-3 °C warmer, and sea level was about 25 m higher (Dowsett, 2007). It was also during the Piacenzian (between 3.6 and 2.4 Ma) that restricted local scale glaciations transitioned to extensive regional scale glaciations on the circum-Arctic continents (e.g., Fronval & Jansen, 1996; Mudelsee & Raymo, 2005). Paleoclimatologists interested in this warm interval as a possible analog to future warming, as well as other climate researchers intrigued by the transition between this warm period and the subsequent onset of Northern Hemisphere glaciation, recognize the potential of mid-Piacenzian climate reconstructions to reveal uncertainties regarding climate sensitivity. As a result, a wealth of paleoclimate data exists for this warm interval, but most is restricted to lower latitudes where traditional paleoclimate proxy methods (i.e., inferring  conditions from faunal assemblage data) work best.

The USGS Pliocene Research, Interpretation and Synoptic Mapping (PRISM) Project is charged with reconstructing global conditions during the ~3.3 to 3.0 Ma time interval (hereafter “the mid-Piacenzian”) in an effort to better understand past and possible future climate dynamics. PRISM reconstructions of sea-surface temperature (SST), based largely on planktic foraminifer assemblage data, indicate that temperature  differences between the mid-Piacenzian and modern increase with latitude in the North Atlantic (Dowsett et al., 1992). That is, mid-Piacenzian temperatures near the equator were similar to modern temperatures, but temperatures in the higher latitudes were several degrees warmer than at present. This reconstructed equator-to-pole gradient has been indeterminate at and above ~66° N, however, because temperature estimates from polar regions such as the Nordic Seas and Arctic Ocean have remained elusive due to the lack of geologic proxies yielding quantitative results as well as weak age control.

[Continued at link below...]

*e-mail: mmrobinson@usgs.gov

Link:  http://micropress.org/stratigraphy/papers/Stratigraphy_6_4_265-275.pdf

Arctic Ocean may be ice free by 2014; Greenland and Antarctica melting faster - Arctic Monitoring and Assessment Program

Gore: Polar ice may vanish in 5-7 years


by CHARLES J. HANLEY, AP Special Correspondent, December 14, 2009

COPENHAGEN – New computer modeling suggests the Arctic Ocean may be nearly ice-free in the summertime as early as 2014, Al Gore said Monday at the U.N. climate conference. This new projection, following several years of dramatic retreat by polar sea ice, suggests that the ice cap may nearly vanish in the summer much sooner than the year 2030, as was forecast by a U.S. government agency eight months ago.

One U.S. government scientist Monday questioned the new prediction as too severe, but other researchers previously have projected a quicker end than 2030 to the Arctic summer ice cap.

"It is hard to capture the astonishment that the experts in the science of ice felt when they saw this," said former U.S. Vice President Gore, who joined Scandinavian officials and scientists to brief journalists and delegates. It was Gore's first appearance at the two-week conference.

The group presented two new reports updating fast-moving developments in Antarctica, the autonomous Danish territory of Greenland, and the rest of the Arctic.

"The time for collective and immediate action on climate change is now," said Denmark's foreign minister, Per Stig Moeller.

But delegates from 192 nations were bogged down in disputes over key issues. This further dimmed hopes for immediate action to cut more deeply into global emissions of greenhouse gases.

Gore and Danish ice scientist Dorthe Dahl Jensen clicked through two slide shows for a standing-room-only crowd of hundreds in a side event at the Bella Center conference site.

One report, on the Greenland ice sheet, was issued by the Arctic Monitoring and Assessment Program, an expert group formed by eight Arctic governments, including the United States. The other, commissioned by Gore and Norway's government, was compiled by the Norwegian Polar Institute on the status of ice melt worldwide.

Average global temperatures have increased 0.74 °C (1.3 °F) in the past century, but the mercury has risen at least twice as quickly in the Arctic. Scientists say the makeup of the frozen north polar sea has shifted significantly in recent years as much of the thick multiyear ice has given way to thin seasonal ice.

In the summer of 2007, the Arctic ice cap dwindled to a record-low minimum extent of 4.3 million km² (1.7 million square miles) in September. The melting in 2008 and 2009 was not as extensive, but still ranked as the second- and third-greatest decreases on record.

Last April, the U.S. National Oceanic and Atmospheric Administration predicted that Arctic summers could be almost ice-free within 30 years, not at the 21st century's end as earlier predicted.

Gore cited new scientific work at the U.S. Naval Postgraduate School, whose Arctic ice research is important for planning polar voyages by Navy submarines. The computer modeling there stresses the "volumetric," looking not just at the surface extent of ice but its thickness as well.

"Some of the models suggest that there is a 75% chance that the entire north polar ice cap during some of the summer months will be completely ice-free within the next five to seven years," Gore said. His office later said he meant nearly ice-free, because ice would be expected to survive in island channels and other locations.

Asked for comment, one U.S. government scientist questioned what he called this "aggressive" projection.
"It's possible but not likely," said Mark Serreze of the U.S. National Snow and Ice Data Center in Boulder, Colorado. "We're sticking with 2030."

On the other hand, a leading NASA ice scientist, Jay Zwally, said last year that the Arctic could be essentially ice-free within "five to less than 10 years."

Meanwhile, what's happening to Greenland's titanic ice sheet "has really surprised us," said Jensen of the University of Copenhagen.

She cited one huge glacier in west Greenland, at Jakobshavn, that in recent years has doubled its rate of dumping ice into the sea. Between melted land ice and heat expansion of ocean waters, the sea-level rise has increased from 1.8 millimeters a year to 3.4 millimeters (0.07 inch a year to 0.13 inch) in the past 10 years.

Jensen said the biggest ice sheets — Greenland and West Antarctica — were already contributing 1 millimeter (0.04 inch) a year to those rising sea levels. She said this could double within the next decade.
"With global warming, we have woken giants," she said.

Link:  http://news.yahoo.com/s/ap/20091215/ap_on_sc/climate_gore

Robert Corell, Dahl-Jensen express great concern over the increasing velocity of glacier outflow on Greenland; Gore focuses on water scarcity looming for a billion people

Robert Corell, Dahl-Jensen express great concern over the increasing velocity of glacier outflow on Greenland; Gore focuses on water scarcity looming for a billion people


COPENHAGEN (AFP) – Climate guru Al Gore warned UN climate talks Monday that the record melting of glaciers worldwide could deprive more than a billion people of access to fresh water.

"There are more than a billion people on the planet who get more than half of their drinking water -- many of them all of their drinking water -- from the seasonal melting of snow melt and glacier ice," Gore said at the release of a report he co-sponsored.

A triple threat from crumbling ice sheets, disappearing glaciers and the shrinking Arctic ice cap are feeding global warming and will fuel rising sea levels, the report found.

Adding to an avalanche of bad scientific news over the last two years, the former US vice president also cited new research showing that the Arctic ice cap may have shrunk to record-low levels last year.

"2008 had a smaller minimum, probably, than 2007," Gore said, alluding to work led by California-based researcher Wieslaw Maslowski.

"Some of the models suggest to Dr. Maslowski that there is a 75% chance that the entire polar ice cap during some summer months could be completely ice free within five to seven years," Gore said.

Scientists reported in September that the Arctic ice cover -- which helps beat back the Sun's heat-delivering rays back into space -- had reversed course compared to 2007, when it had shrunk to its smallest size since the start of accurate measurements some four decades ago.

But when measured by volume, it turns out that the 4.5 million km² (1.7 million sq miles) area in 2008 was actually smaller than the year before.

The Arctic ice cover does not affect sea levels, but is a critically important barrier to global warming.
Intact, its white surface acts as a mirror, but when the ice disappears it becomes a sponge.

"Instead of 85% of the solar energy being reflected, 85% is absorbed in the Arctic Ocean," said Gore who was awarded the Nobel Peace Prize in 2007 for his work on warning of the threat posed by climate change.

One of the report's authors, Robert Corell of the H. John Heinz III Center for Science, Economics and the Environment in Washington, pointed to another threat: the massive, accelerating loss of mass -- measured in hundreds of billions of tonnes per year -- from icesheets in Greenland and Antarctica.

Combined with the expansion of ocean water due to global warming, the continent-sized icesheets are now set to contribute to a global sea level rise of about a metre by the end of the century, double the mid-point prediction of the UN's benchmark science report in 2007.

"A one meter rise equals 100 million people who will have to move, one hundred million environmental refugees," said Corell.

"We have woken giants," said Arctic ice specialist Dorothe Dahl-Jensen at Copenhagen University of the ice sheets.

"This is really scary. This really shakes us scientists. These icesheets are enormous," she said in presenting a second report on Greenland from the Arctic Monitoring and Assessment Programme.

Greenland's ice block holds enough frozen water to lift seas seven metres, while West Antarctica could add another five metres to the global water mark.

Dahl-Jensen said the pace at which some glaciers on the west coast of Greenland were "calving," or falling into the sea, has sped up dramatically over the last decade.

"This is by far the fastest flowing ice we have ever dreamed of. This is a rate of loss that we have never seen before," she said.

Both scientists pointed out that all of these impacts had been unleashed by a less than 1.0 °C (1.8 °F) increase of global temperatures since pre-industrial times.

"Current proposals from individual countries for their own actions would lead to a temperature increase of approximately 3.8 °C (6.8 °F)", by the end of the century, Corell said.

Link:   http://news.yahoo.com/s/afp/20091214/ts_alt_afp/unclimatewarminggore_20091214190858

H.J. Dowsett, M.M. Robinson & K.M. Foley, Clim. Past, Pliocene three-dimensional global ocean temperature reconstruction

Climate of the Past, 5 (2009) 769-783; www.clim-past.net/5/769/2009/

Pliocene three-dimensional global ocean temperature reconstruction

H. J. Dowsett, M. M. Robinson and K. M. Foley (United States Geological Survey, MS 926A, 12201 Sunrise Valley Drive, Reston, VA 20192, U.S.A.)

Abstract

The thermal structure of the mid-Piacenzian ocean is obtained by combining the Pliocene Research, Interpretation and Synoptic Mapping Project (PRISM3) multiproxy sea-surface temperature (SST) reconstruction with bottom water temperature estimates from 27 locations produced using Mg/Ca paleothermometry based upon the ostracod genus Krithe. Deep water temperature estimates are skewed toward the Atlantic Basin (63% of the locations) and represent depths from 1000 m to 4500 m. This reconstruction, meant to serve as a validation data set as well as an initialization for coupled numerical climate models, assumes a Pliocene water mass framework similar to that which exists today, with several important modifications. The area of formation of present day North Atlantic Deep Water (NADW) was expanded and extended further north toward the Arctic Ocean during the mid-Piacenzian relative to today. This, combined with a deeper Greenland-Scotland Ridge, allowed a greater volume of warmer NADW to enter the Atlantic Ocean. In the Southern Ocean, the Polar Front Zone was expanded relative to present day, but shifted closer to the Antarctic continent. This, combined with at least seasonal reduction in sea ice extent, resulted in decreased Antarctic Bottom Water (AABW) production (relative to present day) as well as possible changes in the depth of intermediate waters. The reconstructed mid-Piacenzian three-dimensional ocean was warmer overall than today, and the hypothesized aerial extent of water masses appears to fit the limited stable isotopic data available for this time period.


Final Revised Paper (PDF, 3065 KB)   Supplement (65 KB)   Discussion Paper (CPD) 


Link:  http://www.clim-past.net/5/769/2009/cp-5-769-2009.html

NOAA's NSIDC, Dec. 7, 2009: Low ice extent in Barents Sea and Hudson Bay

NOAA's NSIDC December 7, 2009 Report:

Low ice extent in Barents Sea and Hudson Bay

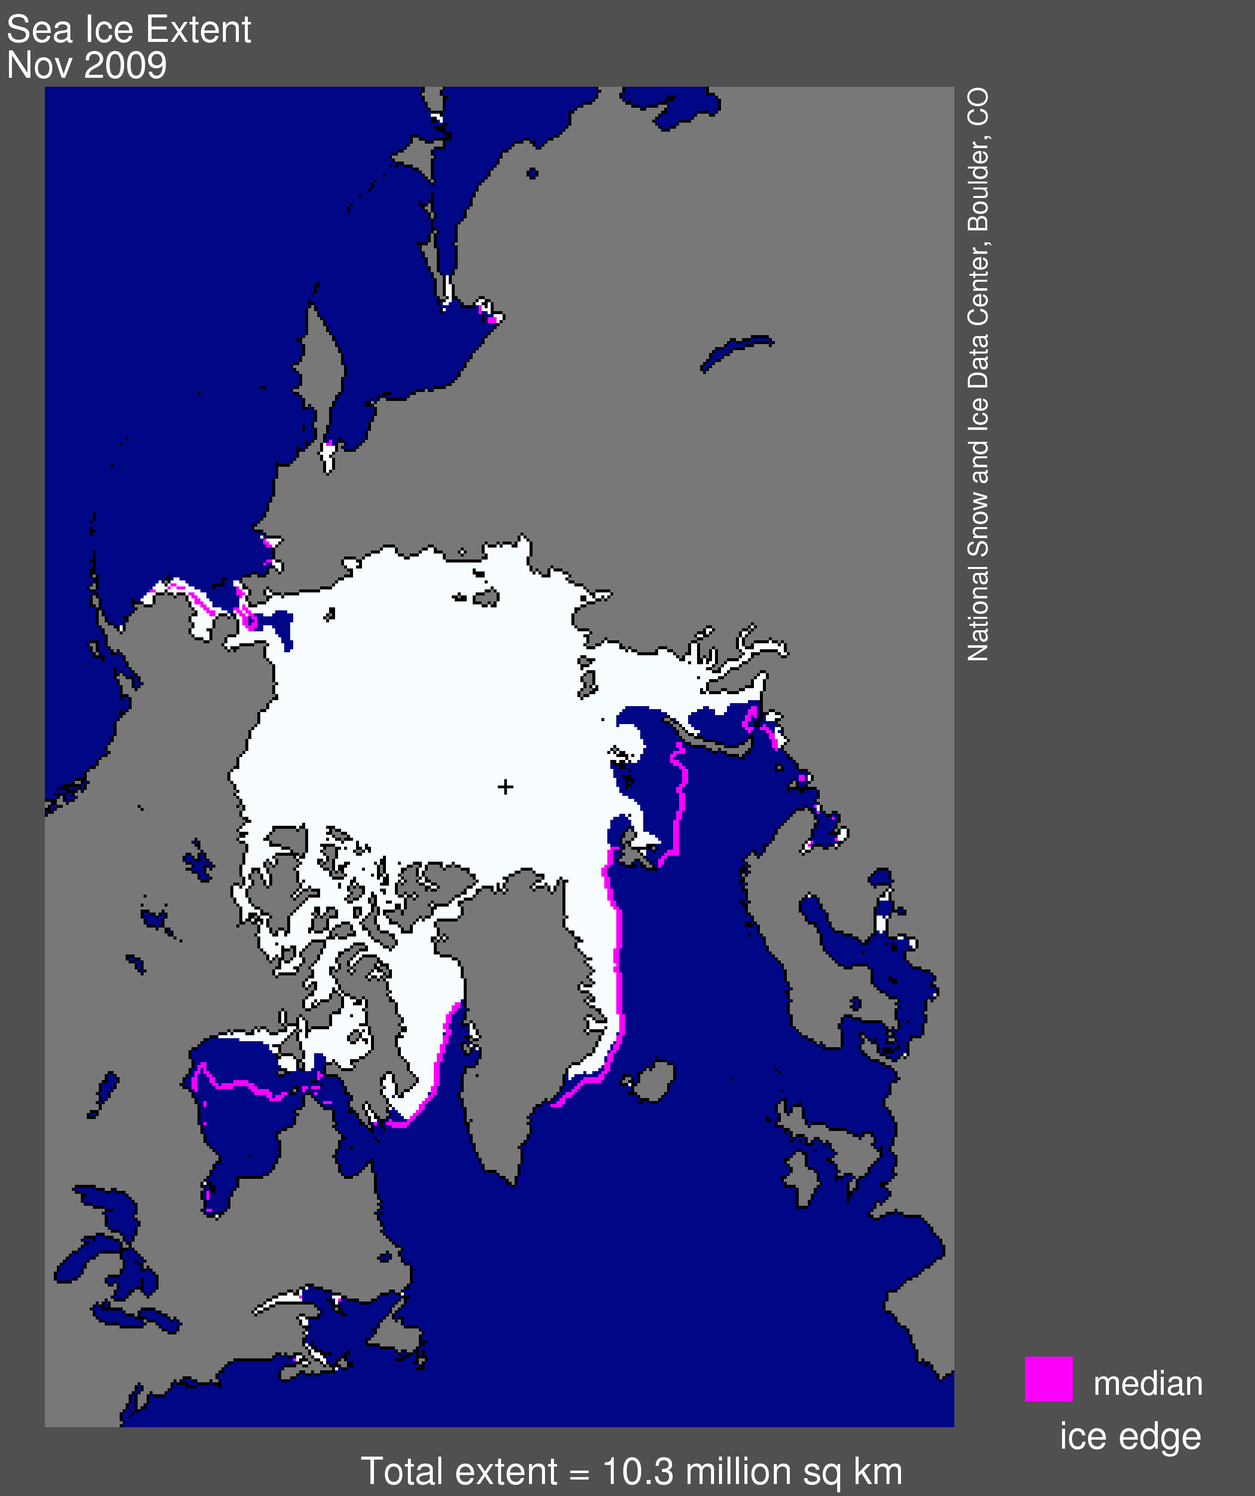
In November 2009, the average rate of Arctic sea ice growth slightly exceeded the 1979-2000 average growth rate for the month. However, at the end of the month, some regions, in particular the Barents Sea and Hudson Bay, still had much less ice cover than normal.


map from space showing sea ice extent, continentsFigure 1. Arctic sea ice extent for November 2009 was 10.26 million square kilometers (3.96 million square miles). The magenta line shows the 1979 to 2000 median extent for that month. The black cross indicates the geographic North Pole. Sea Ice Index data. About the data. —Credit: National Snow and Ice Data CenterHigh-resolution image

Overview of conditions
Arctic sea ice extent averaged over November 2009 was 10.26 million km² (3.96 million square miles). This was 1.05 million km² (405,000 square miles) below the 1979-2000 average for November, but 420,000 km² (160,000 square miles) above the record low for the month, which occurred in November 2006. In general, the ice edge is now at or slightly beyond its average location, with two notable exceptions: Hudson Bay and the Barents Sea.
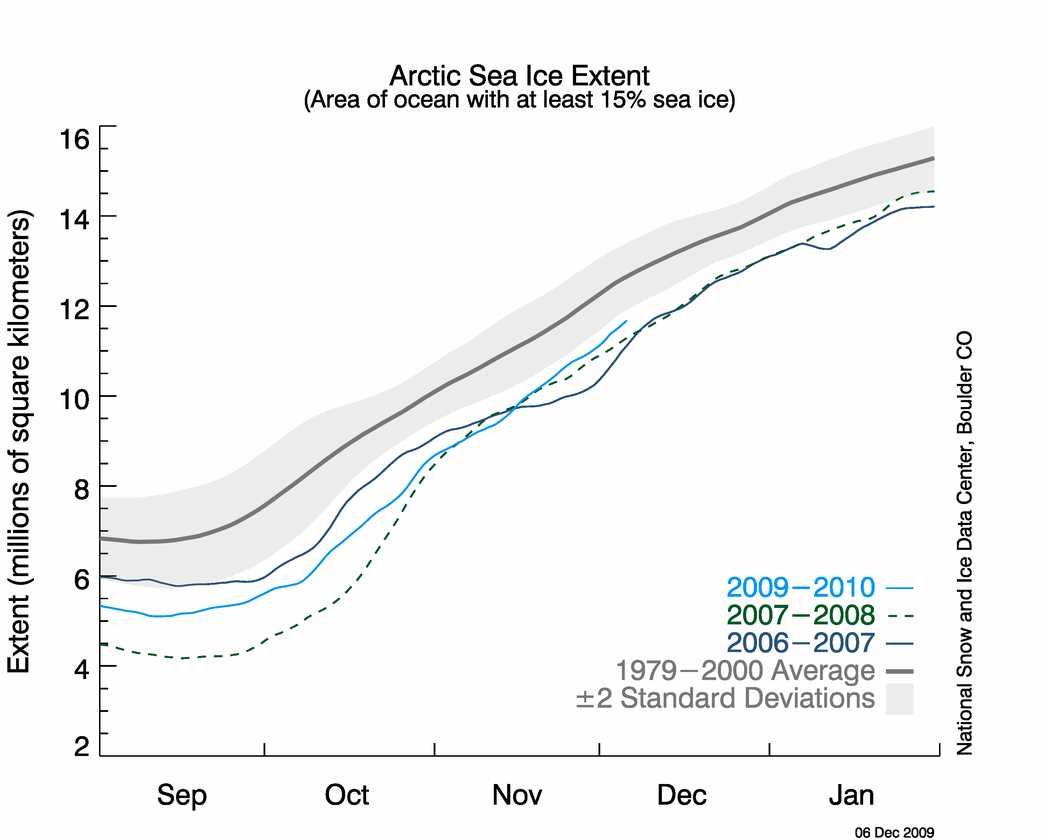
graph with months on x axis and extent on y axis Figure 2. The graph above shows daily sea ice extent as of December 6, 2009. The solid light blue line indicates 2009; dark blue shows 2006, dashed green indicates 2007; and solid gray indicates average extent from 1979 to 2000. The gray area around the average line shows the two standard deviation range of the data. Sea Ice Index data. —Credit: National Snow and Ice Data Center. High-resolution image

Conditions in context
By November, much of the Arctic is in complete or near complete darkness. Air temperatures fall dramatically and sea ice grows rapidly. During November 2009, extent grew at an average 82,000 km² per day (32,000 square miles per day). The rate of increase in sea ice extent was slower during the first half of November, and faster during the latter half.

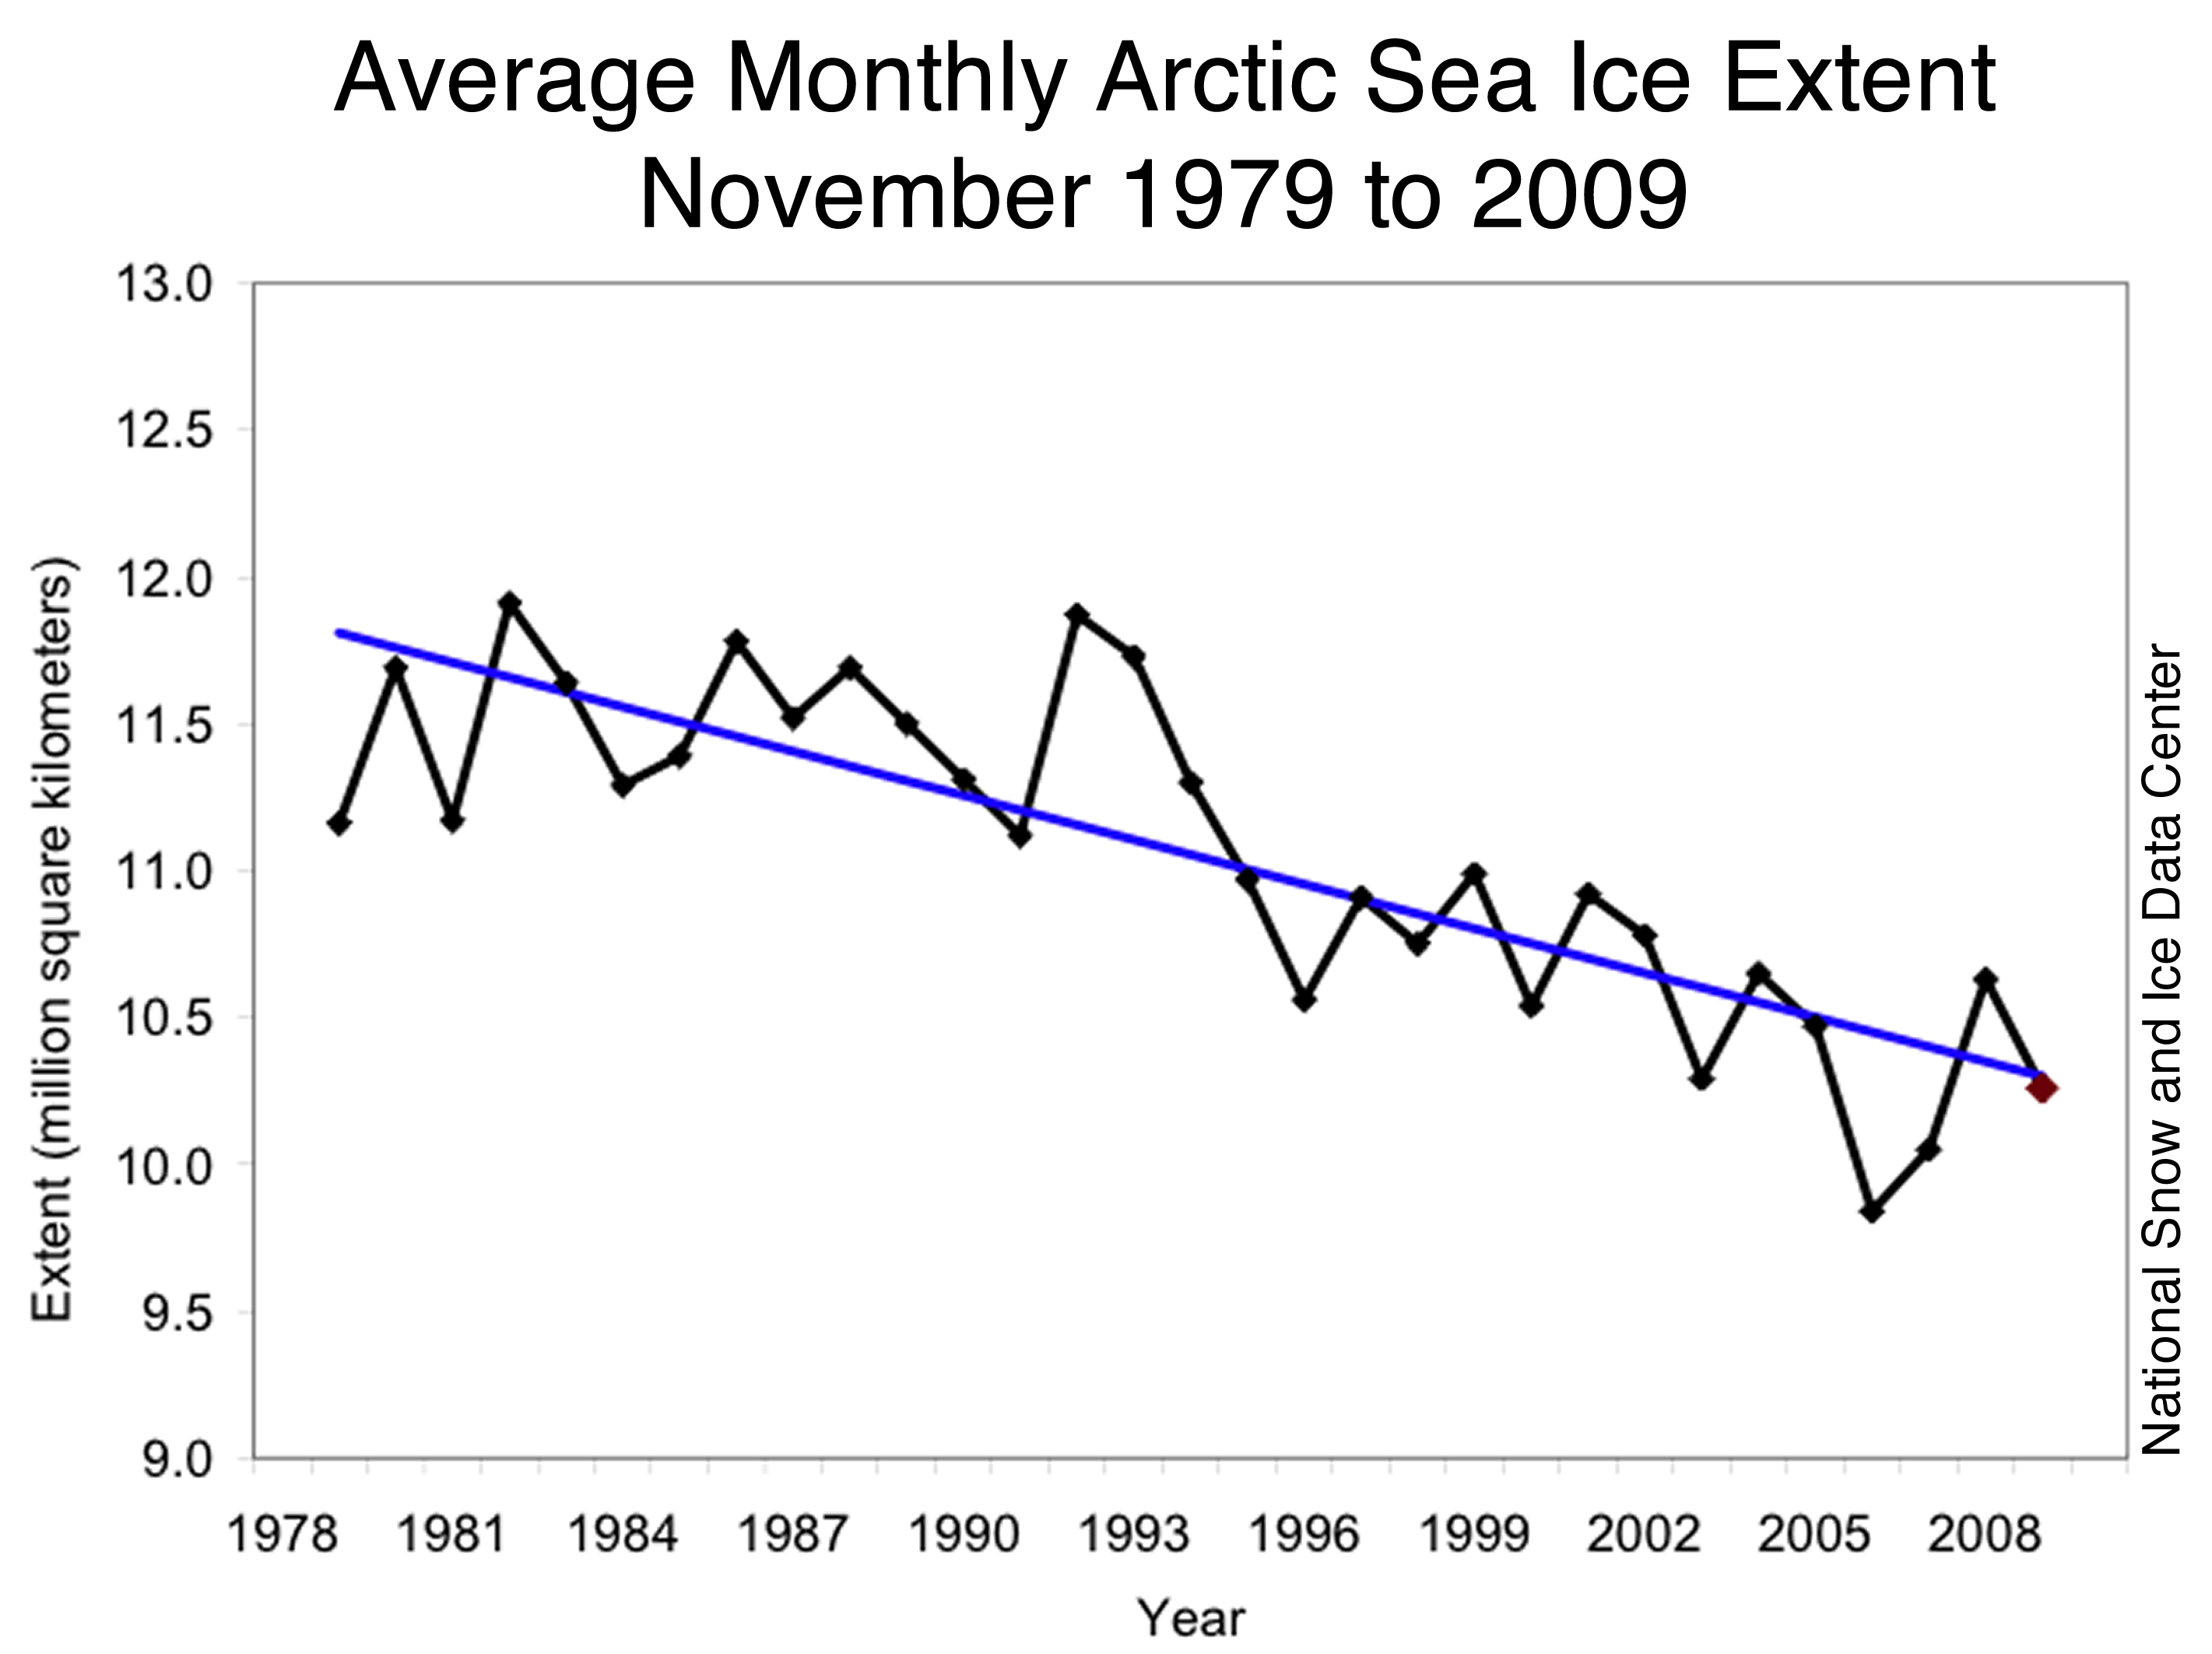
average monthly data from 1979-2000 Figure 3. Monthly November ice extent for 1979 to 2009 shows a decline of 4.5% per decade. —Credit: National Snow and Ice Data Center. High-resolution image

November 2009 compared to past years
November 2009 had the third-lowest average extent for the month since the beginning of satellite records. The linear rate of decline for the month is now 4.5% per decade.

figure 4: sea level pressure map for November Figure 4. The map of sea level pressure (in millibars) for November 2009, shows low pressure in the North Atlantic and high pressure over Russia, which led to winds that brought warmth to the Barents Sea and pushed the ice northward. —Credit: National Snow and Ice Data Center courtesy NOAA/ESRL Physical Sciences Division.  High-resolution image

Slow ice growth: a tale of two regions
Both Hudson Bay and the Barents Sea have experienced a slow freeze-up this fall. However, the slow sea ice growth in the two regions probably resulted from different processes, highlighting the complex interactions between the sea ice, atmosphere and ocean. In the Barents Sea, ice growth was slowed by winds that pushed the ice northwards into the central Arctic, while warmer-than-usual temperatures contributed to the slow ice growth in Hudson Bay.

The Barents Sea is the deepest of the Arctic coastal seas. It is open on its southern and northern boundaries, allowing winds and currents to move sea ice in and out of the region. In November, southerly winds built up between an area of high pressure over Siberia and low pressure in the northern Atlantic Ocean, in accordance with Buys Ballot's Law. The winds transported warm air and water from the south, and pushed the ice edge northwards out of the Barents Sea.

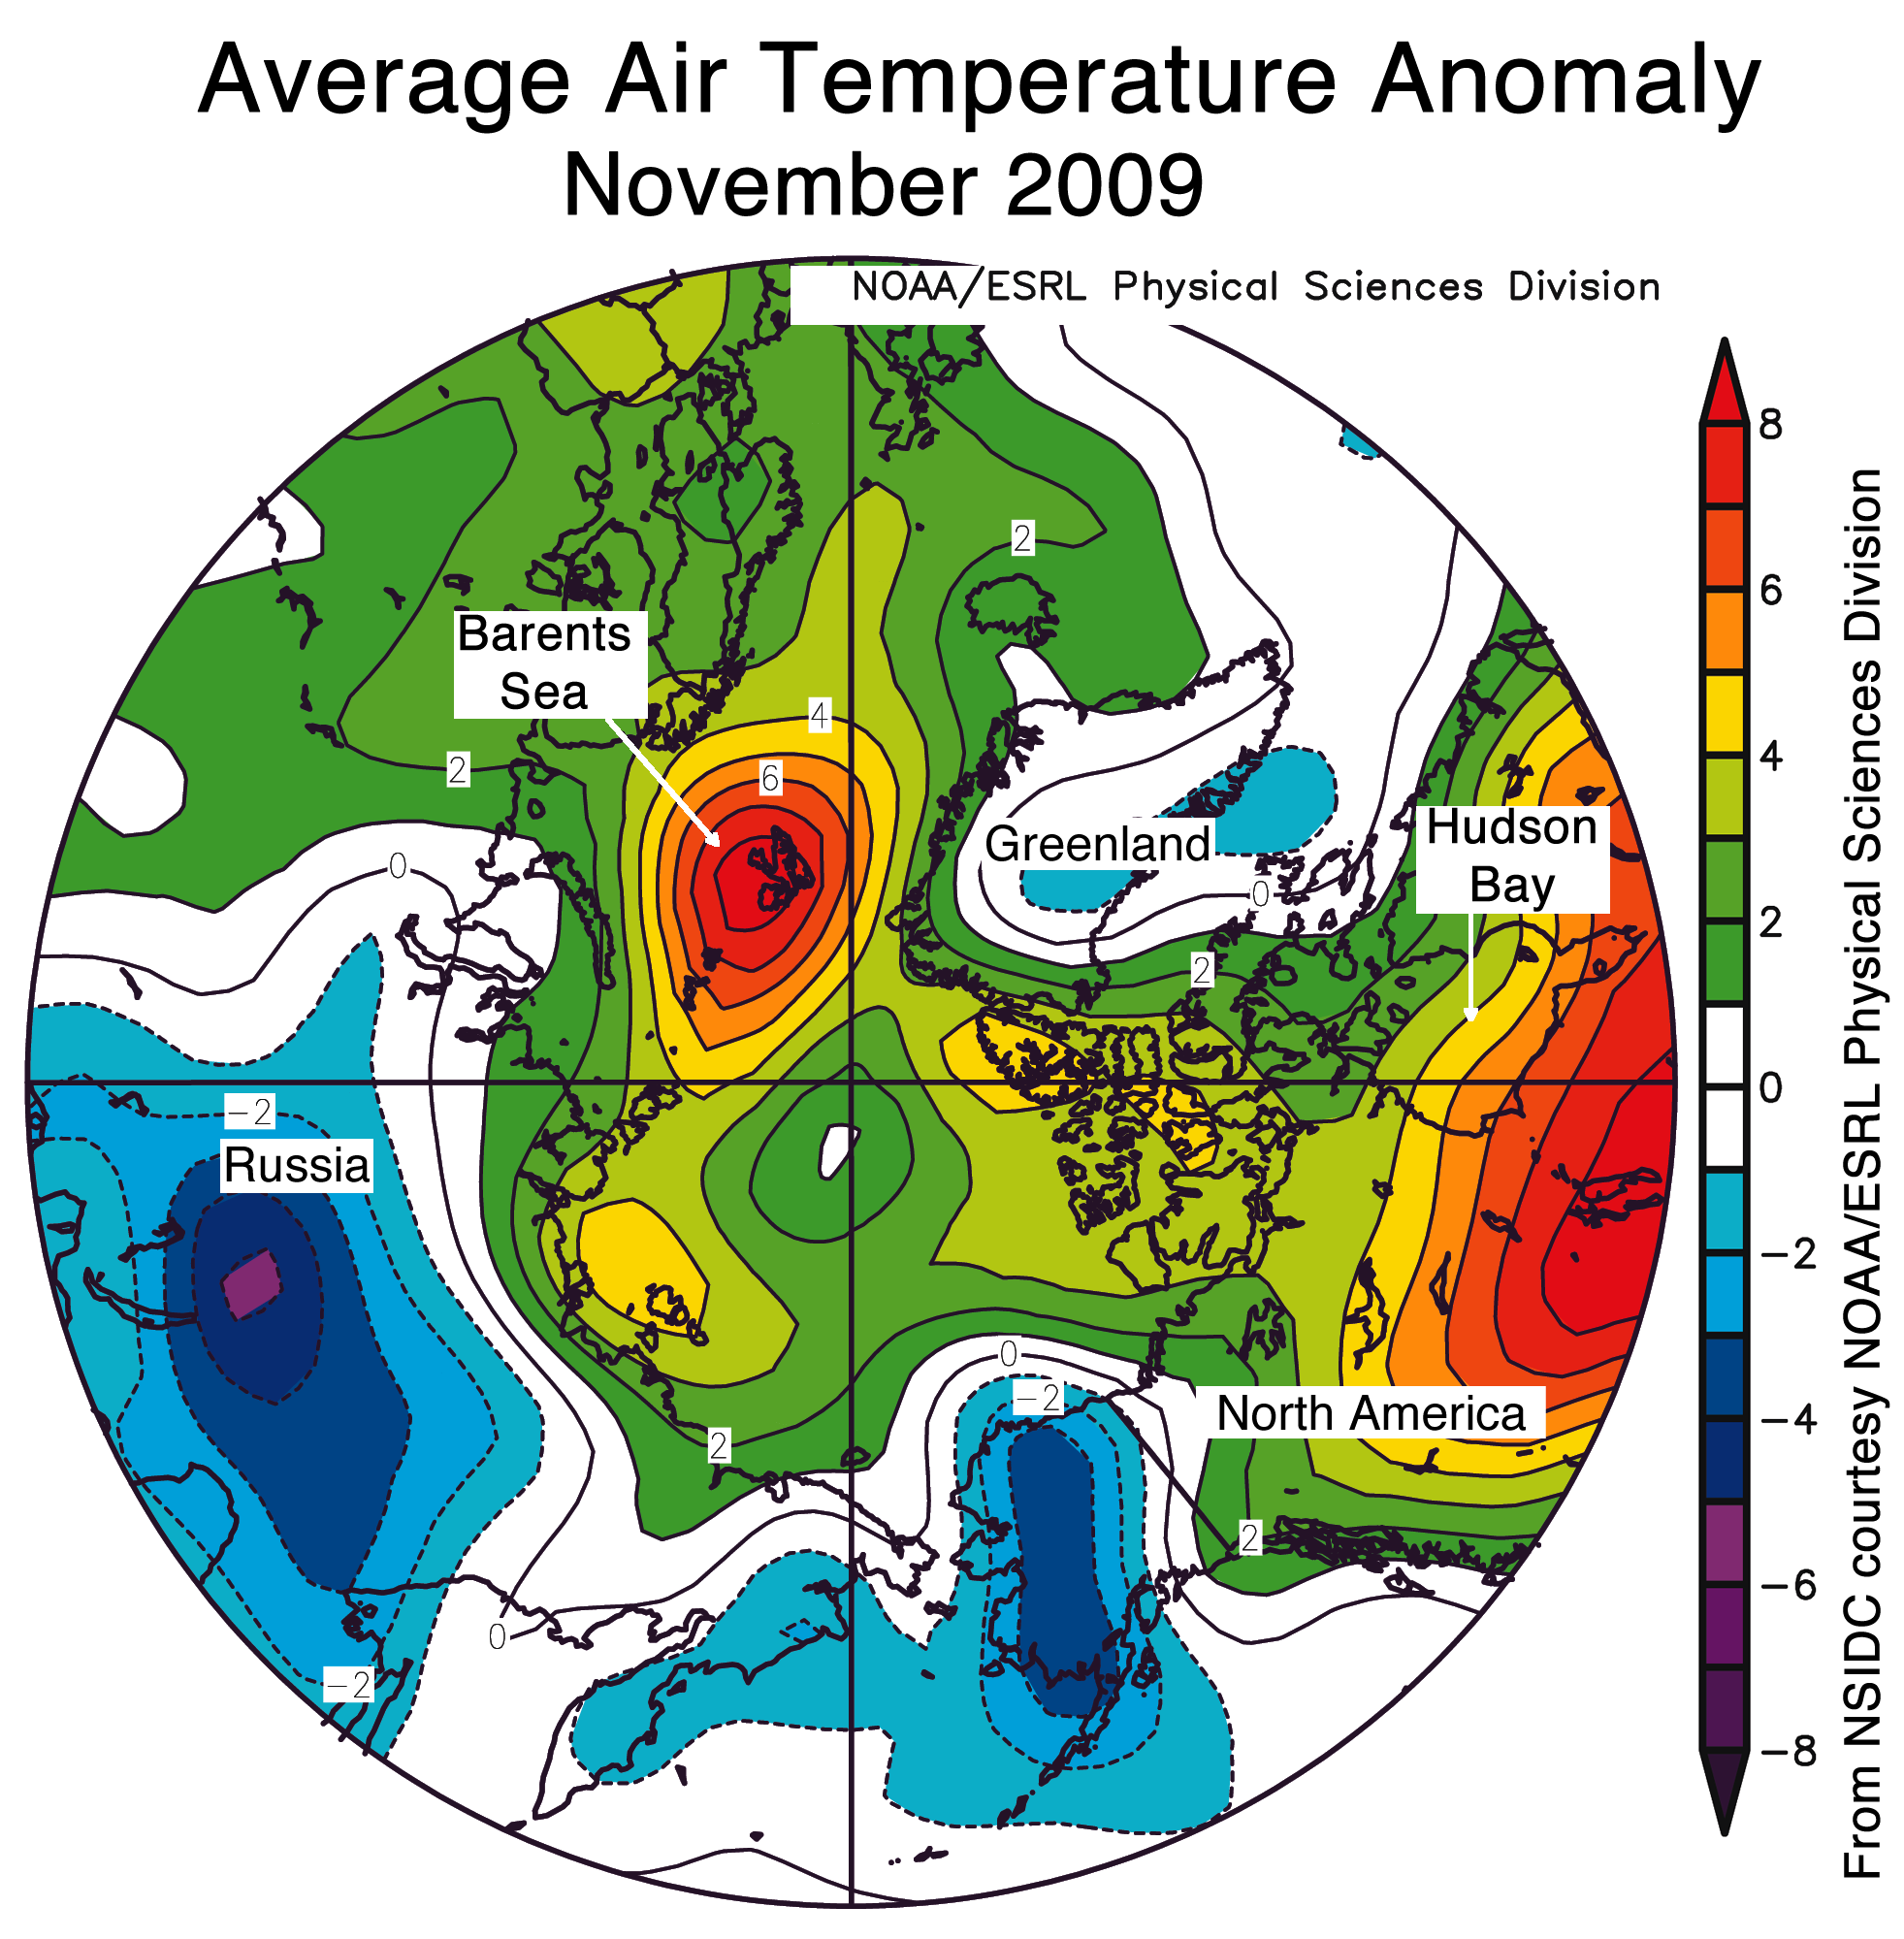
figure 5: air temperature map of arctic for november Figure 5. The map of air temperature anomalies for November 2009, at the 925 millibar level (roughly 1,000 meters [3,000 feet] above the surface), shows warmer than usual temperatures over the Barents Sea and Hudson Bay. Areas in blue correspond to negative (cool) anomalies. Areas in orange and red correspond to strong positive (warm) anomalies. —Credit: National Snow and Ice Data Center courtesy NOAA/ESRL Physical Sciences DivisionHigh-resolution image

In contrast to the Barents Sea, Hudson Bay is a relatively shallow body of water, largely enclosed by land. Ocean waters and sea ice do not flow easily in or out of the bay. The lack of ice in southern Hudson Bay this November is probably related to warmer than normal air temperatures in the region, particularly during the first half of the month.

Air temperatures over Barents Sea were also high during November. While the southerly winds contributed to the warmth, ice-free conditions in the Barents likely also added to the atmospheric heat. Without an insulating cover of sea ice, the ocean releases heat directly to the air.

Link:  http://nsidc.org/arcticseaicenews/

Arctic Ocean undersaturated for calcium carbonate (aragonite)

Arctic Ocean undersaturated for calcium carbonate

by Liz Kalaugher, editor, environmentalresearchweb, November 26, 2009

Shelled organisms in the Canada Basin region of the Arctic Ocean could be about to experience a double whammy. Not only did increased ice melt lead to the area's surface waters becoming undersaturated in 2008 for aragonite, a form of calcium carbonate vital for shell-building, but the retreat of sea ice away from the coast means that undersaturated waters from the depths can now upwell and affect organisms living on the sea floor of the Arctic continental shelf.

"This is the first evidence of omega aragonite undersaturation in deep basin surface waters," Fiona McLaughlin of the Institute of Ocean Sciences, Canada, told environmentalresearchweb. "In a 2009 publication models predicted that the surface waters might be undersaturated in the Arctic within a decade. We're making those observations now, because the ice has melted so fast. Essentially the papers are almost being written at the same time."

Omega is a measure of the saturation state of calcium carbonate; values below one indicate that the waters will dissolve the mineral while values greater than one indicate favourable conditions for forming shells and skeletons.

Oceans around the globe are becoming more acidic as they absorb some of the carbon dioxide that man has emitted into the atmosphere. The Arctic Ocean is also experiencing an indirect effect. "The sea ice has melted and the meltwater is very low in alkalinity and dissolved inorganic carbon, two of the anions that contribute to pH and also to this omega aragonite," explained McLaughlin. In 2007 the extent of Arctic ice was the lowest on record.

Together with colleagues from the Institute of Ocean Sciences, the Japan Agency for Marine-Earth Science and Technology, and Tokyo University of Marine Science and Technology, McLaughlin has monitored conductivity, temperature and depth at four locations in the Canada Basin region of the Arctic Ocean from 2002 to 2008. In 2007, when the team realised that the omega ratio was near one, it decided to do aerial sampling the following year to discover the spatial extent of any undersaturation.

In 1997, the surface waters had an aragonite omega reading of 1.4, leading to "no problem at all to organisms." But in 2008 the level was 1 due to the influx of sea-ice meltwater. "So organisms that live in the upper part of the water column, such as larva of pterapods, are at risk," said McLaughlin.

That's not the only effect of the sea-ice melt. "Because of the retreat of the sea ice so far away from the edges of the shelf, now winds can be at work – much like they are on the west coast of Canada – to bring the water that's at 150 m and quite undersaturated up onto the shelf, and affect benthic organisms like clams and molluscs."

As a result two parts of the water column are affected. "We've got undersaturation in the surface in a large area of the Canada Basin, and then on the shelf we've got potential for upwelling of this undersaturated water," said McLaughlin.

This has implications for the food web. "Organisms that have calcium carbonate in their shells will be at risk, things like pterapods and forams," said McLaughlin. "Certainly laboratory studies exposing organisms to waters of different pH show that this puts them at risk. Now we have evidence that those conditions exist."

Because the Arctic food web is quite simple and short, it could be extremely vulnerable to such changes. But McLaughlin says that it takes time to see how populations are decreasing. "I think this has identified that we need to go out and make counts and do a time series so that we can see whether there are effects and what these organisms' tolerance is," she explained.

Future outlook

The researchers' latest data, which covers a larger area, indicates that the region of undersaturation is even bigger than shown in their paper.

"As there is still ice to melt in the Arctic, this region of undersaturation will continue to grow, I think," said McLaughlin. "It's hard to even say this, but once the permanent icepack melts in summer, that will stop the input of meltwater."

What's more, McLaughlin says that within a decade these low-aragonite surface waters will be leaving the Arctic and entering the North Atlantic. That means the phenomenon could affect a much larger area, providing an additional source of undersaturation on top of the ocean acidification that is already happening.
 
McLaughlin and colleagues have funding for another five years of surveys in the Canada Basin. "These time series are incredibly powerful in being able to identify change," she said. "We've been doing these measurements in the Arctic since the late 1980s. We're fortunate that the ice has retreated so much because it allows us to survey such a large area in 4–6 weeks; the downside is that the ice is disappearing and becoming thinner. It's an interesting time as a researcher but as a person living on the planet it's more worrisome. The planet is changing much more rapidly than anyone had thought."

The researchers reported their work in Science.

Arctic warming spike predicted for February 2010


Arctic Global Warming Spike Imminent (Republishing)

THE ARCTIC SHOULD PREPARE FOR A BLAST OF HEAT IN 2010


UK Met Office Arctic Temperature Feb 2009
The respected UK Met Office Hadley Centre has put up some striking maps on Google Earth Outreach: Environment and Science. The one showing projected temperature increase in the Arctic region by next year is surprising and very alarming.

UK Met Office Arctic Temperature Feb 2010
Simplified Instructions:
To view these maps on Google Earth Outreach, first download the latest version of Google Earth. The click on Climate Change in Our World to enter through the Met Office portal. Below the thumbnail image of a mustard-coloured map of Europe, click on “Open this KML.” 
An interactive globe showing the Arctic region will load. The only feature presented on this interface is that of temperature increase from 1999 to 2099, but you should have no trouble making out the shape of Greenland, with yellow and some orange colour marking its shoreline. Scientific data determines the colouring of the map, with deepening shades of yellow to orange, and as time progresses, to red. These colours show temperature anomalies, or above-normal temperatures.
You can use your cursor as a hand or a pointer. You can grab the globe to turn it around. Try using your pointer to move the toggle on the white time-line bar above. You can toggle in ten year increments, flash back and forth from the beginning to the end, or carefully move the toggler year by year.
Moving the toggler a slight bit from 2009 to 2010, you will see the spike in the Arctic temperature that is projected by the beginning of next year. This may make you instinctively lean back from away your computer. Seeing this abrupt change almost like being hit by a blast of heat from your monitor.
As most of you know, the temperature of the air and waters surrounding Greenland is of special significance. Warmer temperatures are causing the ice sheets and glaciers of Greenland to melt and slide into the sea, forcing a global sea-level rise that is now twice as much as was predicted just two years ago by the Intergovernmental Panel on Climate Change (IPCC).
Moreover, the melting of the floating Arctic sea ice is exposing more and more of the ocean to the heat of the sun and driving more warming for the entire planet. Wind and water currents are being affected, causing unstable climatic conditions and extreme weather.
Through Google Earth Outreach, we are looking at a forceful image of Dangerous Climate Change and a warning to world leaders of the urgency of taking immediate action to drastically reduce greenhouse gas emissions.
These projections by the Met Office Hadley Centre are in the median range; they don’t show the worst-case scenario. If you toggle all the way to the end of this century, you will see what will happen if we don’t change our way of living on our planet. RIGHT NOW.
Admin
For more information, click here to go to the Met Office Hadley Centre website.
To watch a video about the features of Google Earth Outreach, with much more information, click here to go to the Alternative Energy News website.
Also see Google Earth Warms at the excellent Climate Feedback site.

Update:  West Coast Climate Equity has left a new comment on your post "Arctic warming spike predicted for February 2010":

Tenney, we've just updated this post with a link to a December 10 article in The Telegraph: http://www.telegraph.co.uk/earth/copenhagen-climate-change-confe/6780685/Copenhagen-climate-conference-Met-Office-predict-2010-will-be-warmest-on-record.html.

There are more articles on this subject, deserving of a separate post. Right now, it looks as if we're still on track for this warming increase, as the water temperatures in the South Pacific have reached record levels.

[Readers, for the sea surface temperature anomalies that show the intense heat in the middle of the south Pacific Ocean, go to this site:  http://www.osdpd.noaa.gov/ml/ocean/sst/anomaly.html

Pick the date you want and select "full global" to get the big picture.]

A. Shiklomanov: A general increase of river discharge to the Arctic Ocean from Eurasia; 30% higher than average in 2007

Dear Readers,

For those who might not realize the implications of increased flow from rivers that empty into the Arctic Sea, permit me to provide some background in my usual non-scientific language.

OK, in areas where there is no permafrost, we have "groundwater" under the ground, right?  This can be quite close to the surface or even very deep as in an aquifer. It flows somewhere, following gravity and the path of least resistance.  Some of it stays underground once it finds its way to a deep area like an aquifer, or it keeps flowing until it reaches streams and rivers.

In areas where there is permafrost, which is usually quite deep, the water is frozen in the ground and doesn't flow anywhere.

But, what can we imagine will occur when the permafrost is no longer "perma"?  Hmm...

Indeed, permafrost is warming up in the regions all around the Arctic Sea, to the point that groundwater is now flowing to the rivers.

This has consequences.  The surface water in the Artic Sea becomes less saline.  And good ol' methane is being released by the permafrost, and as this process continues, the land subsides.  It becomes a big mushy mess basically not good for anything.  Buildings fall over, roads sink, gas belches out of the thermokarst lakes.  The warming in the Arctic amplifies.

River Discharge
A. Shiklomanov
University of New Hampshire, Durham, NH
August 27, 2009

A general increase of river discharge to the Arctic Ocean from Eurasia was observed over the period 1936-2007, with a rate of annual change (defined from the linear trend) of 2.7 ± 0.5 km3/year (Fig. R1). The most pronounced positive (increasing) trend for the six largest Eurasian rivers is observed during the last 21 years (1987-2007), at a rate of 11.8 km3/year. The rate of discharge has continued to increase in the 21st century. The mean 2000-2007 discharge was 171 km3 higher (10%) than the long-term average over the period 1936-1999. A new historical maximum for Eurasian river discharge to the Arctic Ocean was observed in 2007, reaching 2250 km3/year or 30% higher than the long-term mean discharge from 1936-1999, reported in Peterson et al. (2002).
annual river discharge

Figure R1. Total annual river discharge to the Arctic Ocean from the six largest rivers in the Eurasian Arctic for the observational period 1936-2007 (updated from Peterson et al., 2002) (red line) and from the five large North American pan-Arctic rivers over 1973-2006 (blue line). The least squares linear trend lines are shown as dashed lines. Provisional estimates of annual discharge for the six major Eurasian Arctic rivers based on near real time data from http://RIMS.unh.edu are shown as red diamonds.

The mean annual discharge to the ocean over 2000-2007 from the 5 large North American Arctic rivers based on data from the Environment Canada and USGS was about 6% (31 km3) greater than the long-term mean from 1973-1999. The river discharge during 2007 was higher than the long-term mean and, taking into account that this year had extremely high fresh water discharge from Greenland (Mernild et al., 2009), we can estimate that 2007 showed record high total freshwater input to the Arctic Ocean from the terrestrial land surface.

Official river discharge data are usually processed and published with some delay, the longest delay often being associated with rivers in cold regions that are ice covered for extended periods (Shiklomanov et al. 2006). To provide for more timely detection and diagnosis of changing conditions, a method to estimate near-real time river discharge from the most important Russian monitoring sites, based on provisional stage measurements and river ice data, has been developed in cooperation with the Arctic and Antarctic Research Institute (AARI) (http://RIMS.unh.edu). The provisional estimates over 2003-2007 show a tendency to underestimate the annual observed values within an error of 5% of the officially released data (Figure R1). The preliminary estimate of annual river discharge to the Arctic Ocean from the major Russian rivers in 2008 was significantly greater than the long-term mean but lower than the historical maximum observed in 2007. The North American annual river discharge to the Arctic Ocean in 2008 was probably close to or slightly higher than the long-term mean. However, this estimate is much less reliable due to gaps in near real time discharge data for major North American rivers.

References
Mernild, S. H., G. E. Liston, C. A. Hiemstra, and K. Steffen, 2009: Record 2007 Greenland Ice Sheet surface melt extent and runoff. Eos, Trans. Amer. Geophys. Union, 90, doi:10.1029/2009EO020002.
Peterson, B. J., R. M. Holmes, J. W. McClelland, C. J. Vorosmarty, R. B. Lammers, A. I. Shiklomanov, I. A. Shiklomanov, and S. Rahmstorf, 2002: Increasing river discharge to the Arctic Ocean. Science, 298, 2171-2173.
Shiklomanov A. I., T. I. Yakovleva , R. B. Lammers, I. Ph. Karasev, C. J. Vörösmarty, and E. Linder, 2006: Cold region river discharge uncertainty - estimates from large Russian rivers. J. of Hydrol., 326, 231–256.

Extraordinary September Arctic sea ice reductions and their relationships with storm behavior over 1979–2008

Geophysical Research Letters, 36 (2009) L19715; doi: 10.1029/2009GL039810.

Extraordinary September Arctic sea ice reductions and their relationships with storm behavior over 1979–2008

Ian Simmonds and Kevin Keay (School of Earth Sciences, The University of Melbourne, Victoria, Australia)

Received 29 June 2009; accepted 1 September 2009; published 14 October 2009

Abstract

Dramatic changes have been observed in Arctic sea ice, cyclone behavior and atmospheric circulation in recent decades. Decreases in September ice extent have been remarkable over the last 30 years, and particularly so in very recent times. The analysis reveals that the trends and variability in September ice coverage and mean cyclone characteristics are related, and that the strength (rather than the number) of cyclones in the Arctic basin is playing a central role in the changes observed in that region, especially in the last few years. The findings reinforce suggestions that the decline in the extent and thickness of Arctic ice has started to render it particularly vulnerable to future anomalous cyclonic activity and atmospheric forcing.

Arctic ice reaches historic seasonal low: “We are almost out of multiyear sea ice in the northern hemisphere.”


Arctic ice reaches historic seasonal low: “We are almost out of multiyear sea ice in the northern hemisphere.”

by Joseph Romm, Climate Progress, November 8, 2009
The multiyear ice covering the Arctic Ocean has effectively vanished….
“I would argue that, from a practical perspective, we almost have a seasonally ice-free Arctic now, because multiyear sea ice is the barrier to the use and development of the Arctic,” said Barber [Canada's Research Chair in Arctic System Science at the University of Manitoba].
Arctic 11-09
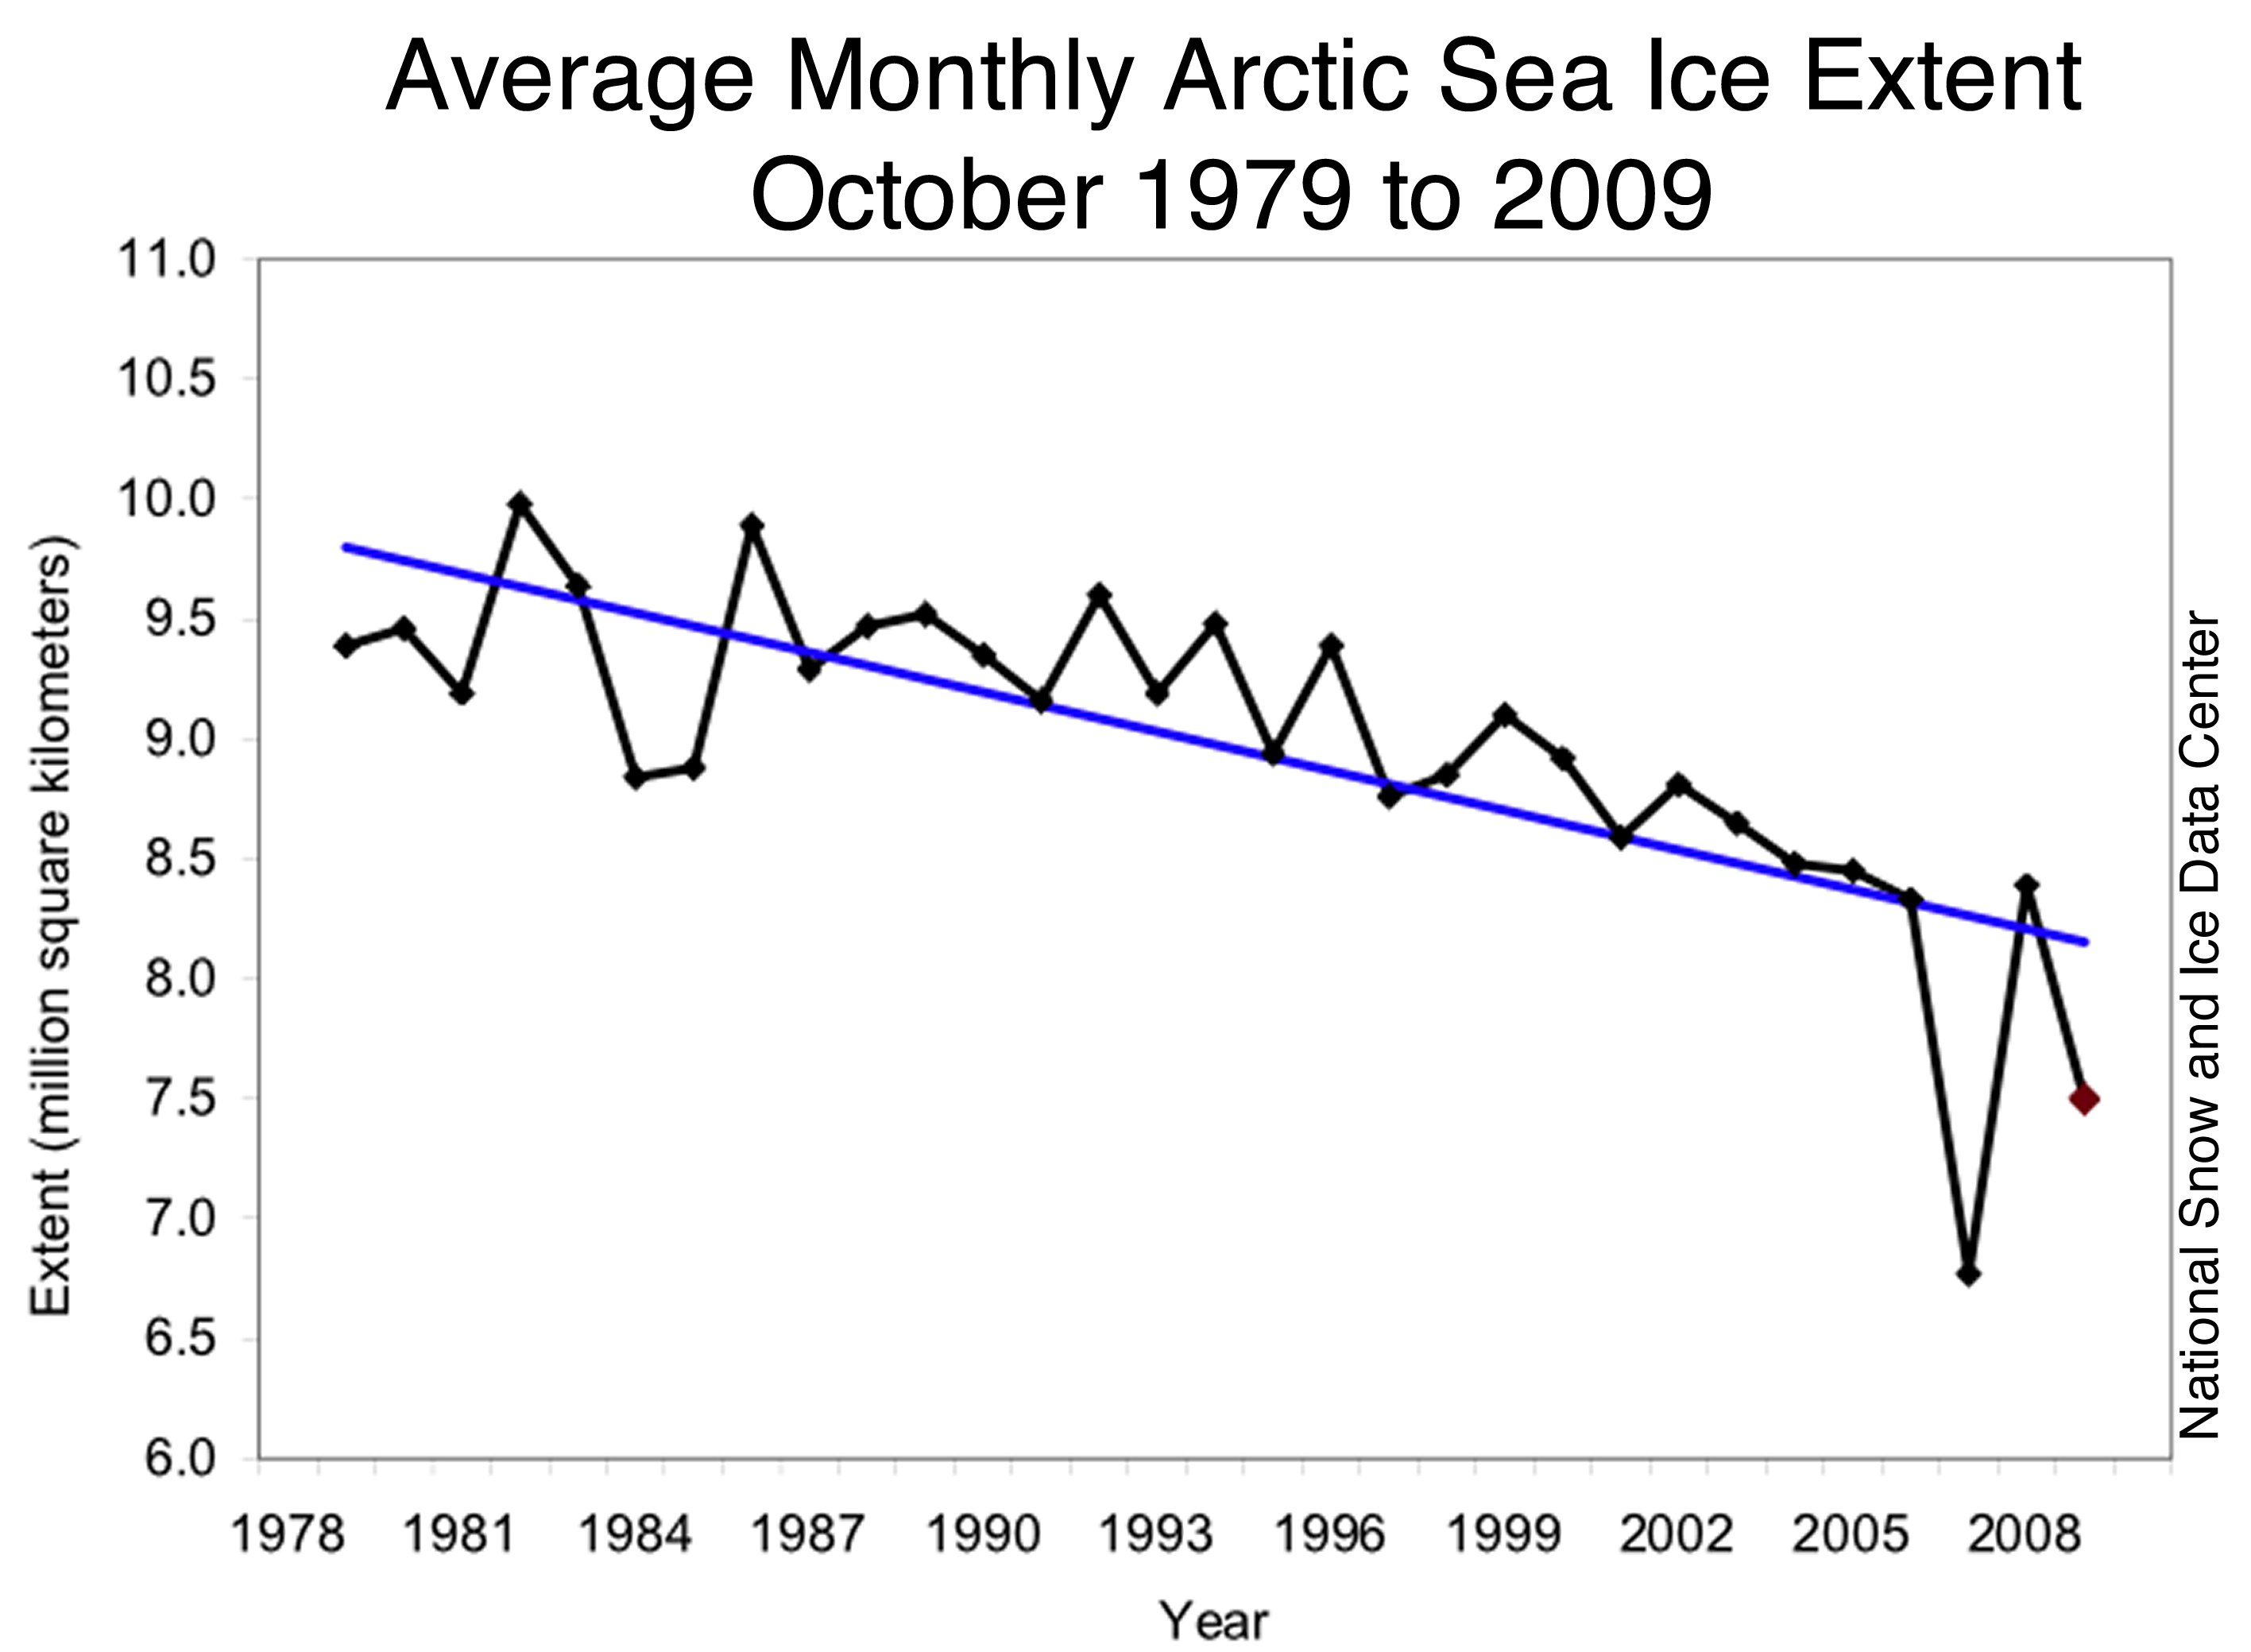
The latest tracking of Arctic sea ice extent from the National Snow and Ice Data Center shows that we’ve hit the record low Arctic sea ice extent for this time of year.  In a post last week, “Warm winds slow autumn ice growth,” NSIDC noted “October 2009 had the second-lowest ice extent for the month over the 1979 to 2009 period.
average monthly data from 1979-2009 for October
As Reuters noted in their remarkable piece on Canadian cryosphere scientist David Barber, “Scientists link higher Arctic temperatures and melting sea ice to the greenhouse gas emissions blamed for global warming.”

Duh.

Here’s more on what Barber found in a recent expedition:

“We are almost out of multiyear sea ice in the northern hemisphere,” he said in a presentation in Parliament. The little that remains is jammed up against Canada’s Arctic archipelago, far from potential shipping routes….

Barber spoke shortly after returning from an expedition that sought — and largely failed to find — a huge multiyear ice pack that should have been in the Beaufort Sea off the Canadian coastal town of Tuktoyaktuk.
 Instead, his ice breaker found hundreds of miles of what he called “rotten ice” — 50-cm (20-inch) thin layers of fresh ice covering small chunks of older ice.
“I’ve never seen anything like this in my 30 years of working in the high Arctic … it was very dramatic,” he said.

“From a practical perspective, if you want to ship across the pole, you’re concerned about multiyear sea ice. You’re not concerned about this rotten stuff we were doing 13 knots through. It’s easy to navigate through.”
Rotten ice — good term.  That’s what human emissions of greenhouse gases have done to the Arctic, covered it in rotten ice.
Photo
Reuters photo caption: “Broken Arctic sea ice as seen from a window in from a U.S. Coast Guard C130 flight over the Arctic Ocean September 30, 2009.”
Scientists have fretted for decades about the pace at which the Arctic ice sheets are shrinking. U.S. data shows the 2009 ice cover was the third-lowest on record, after 2007 and 2008.
An increasing number of experts feel the North Pole will be ice free in summer by 2030 at the latest, for the first time in a million years.

“I would argue that, from a practical perspective, we almost have a seasonally ice-free Arctic now, because multiyear sea ice is the barrier to the use and development of the Arctic,” said Barber.

Fresh first-year ice always forms in the Arctic in the winter, when temperatures plunge far below freezing and the North Pole is not exposed to the sun….

The Arctic is warming up three times more quickly than the rest of the Earth, in part because of the reflectivity, or the albedo feedback effect, of ice.

 As more and more ice melts, larger expanses of darker sea water are exposed. These absorb more sunlight than the ice and cause the water to heat up more quickly, thereby melting more ice.
Barber said the ice was now being melted both by rays from the sun as well as from below by the warmer water.
For more on this well known positive feedback (see “What exactly is polar amplification and why does it matter?)
Scientists are also seeing more cyclones, which pick up force as they absorb heat from the warmer water. The cyclones help generate waves that break up ice sheets and also dump large amounts of snow, which has an insulating effect and prevents the ice sheets from thickening.

After a long search, Barber’s ice breaker finally found a 16-km (10-mile) wide floe of multiyear ice that was around 6-8 meters (20-26 feet) thick. But as the crew watched, the floe was hit by a series of waves, and disintegrated in five minutes.
“The Arctic is an early indicator of what we can expect at the global scale as we move through the next few decades … So we should be paying attention to this very carefully,” Barber said.
We should be paying close attention, since this positive feedback is linked to another, even more dangerous one (see “Tundra 4: Permafrost loss linked to Arctic sea ice loss“).

I asked NSIDC director’s Mark Serreze for a comment on this article, and he wrote me:
Dave Barber’s observations give the sort of on-the-ground confirmation of the situation that lends confidence to predictions that we’re headed towards a seasonally ice-free Arctic Ocean.  Dave’s been up there looking at sea ice conditions for many years. He knows what he’s talking about.
NSIDC Research Scientist Walt Meier also replied:
This is an interesting article. To some extent Dave’s statement depends on how you define multiyear year. Certainly the older ice (e.g., >5 years) is virtually gone and there’s very little 3-4 year-old ice.  However, the past couple years, each summer has retained a fair amount of first-year ice (which ages into second year, and now third year ice). So there is some build-up of what you would term “young” multiyear ice. In theory, that ice could eventually stabilize or even increase (for a time) the multiyear pack. On the other hand, multiyear is constantly moving out of the Arctic as part of the natural drift. So, much of the “young” multiyear ice may be gone before it can mature into older ice.
The most interesting thing in the article is that the old multiyear ice is so broken up now. Even if there is a considerable amount, it is all in broken (or even rotten) floes of ice and not a largely consolidated pack like it used to be. That is a significant change in the character of the ice cover beyond the basic changes in extent and age distribution.
Related posts:
Link: http://climateprogress.org/2009/11/08/arctic-multiyear-sea-ice-nsidc-david-barber/

Comment:

primerica said...

I'm sure ship captains are happy with that. Now they can easily get from the west coast to the east coast through the Arctic ocean instead of the very long way through the Panama canal. It's very sad to see this destruction we've brought upon us though. I just hope that it's still fixable and maybe one day the ice layers will be restored to its previous state.

Take care, Lorne
November 10, 2009 2:52 PM