Showing posts with label Solar activity. Show all posts

Should The Earth Be Cooling? by Michael Searcy, Skeptical Science

Should The Earth Be Cooling?


Current Climate Running Against the Grain

by Michael Searcy, Skeptical Science, September 17, 2010

When considering whether or not the human influence on the Earth’s climate is discernible, one of the immediate questions that comes to mind is, “What would the climate be doing in the absence of human interference?”

Easterbrook Quote
Indeed all climate models strive to identify the impact of natural mechanisms as compared to anthropogenic, or man-made, ones. The general conclusion has been that models of strictly natural influences do a pretty good job at reproducing real world, pre-industrial climate conditions but that the influence of mankind must be incorporated in order to reproduce the climate conditions of the industrial era. But at what point does the human component overwhelm its natural counterparts, when Mother Nature says we should be going in one direction while reality is going the opposite?

While it’s impossible to know exactly what the climate conditions would be in the absence of mankind, we should be able to get a pretty good sense of at least whether or not the global climate would be warming or cooling. The simplest method to make this determination is by examining the trends of a few major natural mechanisms that influence the climate, namely solar irradiance, the El Niño Southern Oscillation (ENSO), and the Pacific Decadal Oscillation (PDO).

Solar Irradiance, ENSO, and PDO

Shifts in solar irradiance generally follow the Sun’s roughly 11-year sunspot cycle, but the magnitude of these cyclic changes is quite small. However, longer term, multi-decadal trends of rising or declining solar activity can have notable climatic impacts here on Earth. Longer periods of high solar activity or dormancy are often associated with the Medieval Warm Period (MWP) and the Little Ice Age (LIA) respectively.Wolter Quote

ENSO and PDO both refer to oceanic and atmospheric patterns in the Pacific Ocean, but they differ from one another. ENSO focuses on conditions near the equator. These conditions alternate between warmer (El Niño) and colder (La Niña) phases, with individual phases lasting from a few months to a year. Each phase can have a noticeable impact on global temperatures, with El Niño conditions driving temperatures higher and La Niña having the opposite effect. A particularly strong El Niño in 1998 is credited with pushing global temperatures to some of their highest levels on record.

Similar to its equatorial cousin, the northern Pacific PDO alternates between warm and cold phases with a warm PDO encouraging warmer temperatures and a cold PDO the opposite. While its phases are less predictable than ENSO they can last much longer, up to multiple decades.

Examining the Last 30 Years

Spencer QuoteSo what has been going on with these three significant and natural climate drivers, particularly when compared to the warming influence of human industrial carbon dioxide (CO2)? NOAA's National Climatic Data Center (NCDC) states, "The average value of a meteorological element over 30 years is defined as a climatological normal," so let’s examine the current 30-year history of each of these natural mechanisms and their respective influences on the global climate.

Figure 1 below depicts the 30-year trend from 1979 to the present of solar irradiance, ENSO, PDO, and atmospheric carbon dioxide. Each trend has been normalized in order to facilitate comparisons on equivalent scales. Each graph also includes the general warming or cooling influence of the trended data on Earth’s climate. Lastly, the normalized trend of global temperatures over the last 30 years is included.

Climate Forcings (Last 30 Years)
Figure 1. 30-Year Climate Forcings: Solar Irradiance, ENSO, PDO, Atmospheric CO2.


Based on the combination of decreased solar activity, a steady ENSO and a declining PDO over the last 30 years, we would expect to be experiencing a cooling climate. However, despite this opposition from multiple natural factors, global temperatures have risen throughout this time period as the concentration of atmospheric CO2 has escalated. Nature indicates the planet should be cooling. The reality has been just the opposite.

What Do Climate Models Say?

But do the climate models concur with this divergence?

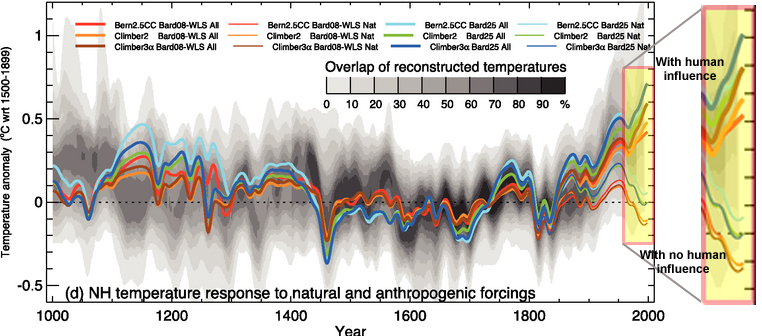
Figure 2 is an excerpt from the IPCC’s 4th Assessment in 2007. Depicted is the output of three climate models. Each model was run reflecting just natural climate influences and also with the inclusion of anthropogenic influences. The different model runs are depicted in color with those reflecting natural+human factors shown in bold. Actual conditions based on direct measurements and proxies are reflected in the background gray range.


Climate Models
Figure 2. Climate models, Figure 6.14, IPCC AR4 WG1 (Click for larger).

Examining the model outputs, as the world enters the industrial age, the models begin to show a split between the results from purely natural influences and those from natural+human factors. However, while the overall trends begin to diverge, the shorter term fluctuations remain in agreement. As the natural result warms, the natural+human result warms. As the natural result cools, the natural+human result cools.

Then things change.

Over the section of the model runs depicting the last 30 years or so, the two model run types diverge completely. While the natural results show a distinct cooling trend in line with the actual observations of solar irradiance, ENSO, and PDO, the results from the natural+human runs show a marked warming trend. This divergence is highlighted in the figure.

Looking at both the actual observations of historically significant climate forcings including solar irradiance, ENSO and PDO and the results from model runs depicting solely natural climate influences, we would expect our planet to be notably cooling.

However, examining climate models including both natural and human influences, we would expect a continued warming trend over the last 30 years.

Which is exactly what's been happening.

Link:  http://www.skepticalscience.com/should_earth_be_cooling.html

The upcoming ice age has been postponed indefinitely

The upcoming ice age has been postponed indefinitely

by John Cook, Skeptical Science, January 27th, 2010

The 9th most popular skeptic argument is that we're heading into an ice age. The whole premise of the website Ice Age Now is that a new ice age could begin any day. Considering the skeptic aversion towards alarmism, it's surprising that this idea has gained so much traction. In the interest of lowering skeptics' stress levels, its time to put all those ice age fears to rest once and for all.

Just a few centuries ago, the planet experienced a mild ice age, quaintly dubbed the Little Ice Age. Part of the Little Ice Age coincided with a period of low solar activity termed the Maunder Minimum (named after astronomer Edward Maunder). It's believed that a combination of lower solar output and high volcanic activity were a major contributor (Free 1999, Crowley 2001), with changes in ocean circulation also having an effect on European temperatures (Mann 2002). 

Solar Activity - Total Solar Irradiance (TSI) including Maunder Minimum
Figure 1. Total Solar Irradiance (TSI). TSI from 1880 to 1978 from
Solanki. TSI from 1979 to 2009 from PMOD.

Could we be heading into another Maunder Minimum? Solar activity is currently showing a long term cooling trend. 2009 saw solar output at its lowest level in over a century. However, predicting future solar activity is problematic. The transition from a period of 'grand maxima' (the situation in the latter 20th century) to a 'grand minima' (e.g., Maunder Minimum conditions) is a chaotic process and difficult to predict (Usoskin, 2007).
Let's say for the sake of argument that the sun does enter another Maunder Minimum over the next century. What effect would this have on Earth's climate? The difference in solar radiative forcing between Maunder Minimum levels and current solar activity is estimated between 0.17 W/m2 (Wang, 2005) to 0.23 W/m2 (Krivova, 2007). In contrast, the radiative forcing of CO2 since pre-industrial times is 1.66 W/m2 (IPCC AR4), far outstripping solar influence. Add to this the extra CO2 emitted in upcoming decades and other greenhouse gases such as methane. The warming from man-made greenhouse gases far outstrips any potential cooling even if the sun was to return to Maunder Minimum levels.

However, our climate has experienced much more dramatic change than the Little Ice Age. Over the past 400,000 years, the planet has experienced ice age conditions, punctuated every 100,000 years or so by brief warm intervals. These warm periods, called interglacials, typically last around 10,000 years. Our current interglacial began around 11,000 years ago. Could we be on the brink of the end of our interglacial?

Temperature of Vostok, Antarctica including interglacials and Milankovitch cycles
Figure 2. Temperature change at Vostok, Antarctica (Barnola, 2003). Interglacial periods are marked in green.

How do ice ages begin? Changes in the earth's orbit cause less sunlight (insolation) to fall on the northern hemisphere during summer. Northern ice sheets melt less during summer and gradually grow over thousands of years. This increases the Earth's albedo which amplifies the cooling, spreading the ice sheets further. This process lasts around 10,000 to 20,000 years, bringing the planet into an ice age.

Not all interglacials last the same amount of time. An ice core from Dome C, Antarctica offered a glimpse of temperatures going back 720,000 years. Climatic conditions 420,000 years ago were similar to current conditions. At that time, the interglacial lasted 28,000 years, suggesting our current interglacial may have lasted a similar period without human intervention (Augustin, 2004).

The similar conditions between now and 400,000 years ago are due to similar configurations in the Earth's orbit. At both times, the forcing from orbital variations showed much less change then in other interglacials. Simulations with the current orbit find that even without CO2 emissions, the current interglacial is expected to last at least 15,000 years (Berger, 2007).

Of course, the question of how long our interglacial lasts without human intervention is moot. We are intervening. So what effect do our CO2 emissions have on any future ice ages? This question is examined in one study that examines the glaciation "trigger" -- the required drop in summer northern insolation to begin the process of growing ice sheets (Archer 2005). The more CO2 there is in the atmosphere, the lower insolation needs to drop to trigger glaciation.

Figure 3 examines the climate response to various CO2 emission scenarios. The green line is the natural response without CO2 emissions. Blue represents an anthropogenic release of 300 gigatonnes of carbon -- we have already passed this mark. Release of 1000 gigatonnes of carbon (orange line) would prevent an ice age for 130,000 years. If anthropogenic carbon release were 5000 gigatonnes or more, glaciation will be avoided for at least half a million years. As things stand now, the combination of relatively weak orbital forcing and the long atmospheric lifetime of carbon dioxide is likely to generate a longer interglacial period than has been seen in the last 2.6 million years.

Future temperature rise based on various CO2 emission scenarios
Figure 3. Effect of fossil fuel CO2 on the future evolution of global mean temperature. Green represents natural evolution, blue represents the results of anthropogenic release of 300 Gton C, orange is 1000 Gton C, and red is 5000 Gton C (Archer, 2005).
 
So we can rest assured, there is no ice age around the corner. To those with lingering doubts that an ice age might be imminent, turn your eyes towards the northern ice sheets. If they're growing, then yes, the 10,000 year process of glaciation may have begun. However, currently the Arctic permafrost is degrading, Arctic sea ice is melting and the Greenland ice sheet is losing mass at an accelerating rate. These are hardly good conditions for an imminent ice age.

Thanks to John Cross for putting me onto a few very relevant papers while preparing this post.

Joseph Romm: The hottest decade ends and since there’s no Maunder mininum — sorry deniers! — the hottest decade begins

The hottest decade ends and since there’s no Maunder mininum — sorry deniers! — the hottest decade begins


2009 ends with a "sunspot surge" as solar cycle 24 revs up, though the sun is increasingly a bit player in the global warming trend

by Joseph Romm, Climate Progress, December 31, 2009

The figure is from Spaceweather.com, in its “Sunspot Surge” post.

The 2000s were  the hottest decade in recorded history by far — even though we’re at “the deepest solar minimum in nearly a century.”  The 2000s were a full 0.2 °C warmer than the 1990s, which of course had been the hottest decade on record, 0.14 °C warmer than 1980s (according to the dataset that best tracks planetary warming).  Hmm.  It’s almost like the warming is accelerating.

There’s little doubt the 2010s will be the hottest decade on record, barring multiple supervolcanoes.  Yet when the anti-science crowd isn’t perversely spending their time trying to stop all efforts to cut global warming pollution that might slow warming, they are perversely trying to convince the public and policymakers we’re not warming at all.  That’s why many of them have been rooting for this deep solar minimum to become a Maunder Minimum, to mute the warming signal and hence the motivation for action for a few more years.  Yes, they have a self-destructive streak.

In fact, even if total solar irradiance (TSI) never recovered, we wouldn’t have entered a period of cooling since, “the negative forcing, relative to the mean solar irradiance is equivalent to seven years of CO2 increase at current growth rates,” as NASA noted in January 2009.  Heck, even with a La Niña and an unusually inactive sun, 2008 was almost 0.1 °C warmer than the hot decade of the 1990s as a whole.  And 2009 now seems likely to be the second hottest year on record after 2005.  Changes in the sun just ain’t the big dog anymore when it comes to driving climate change (see below).

When we last looked at the sun [please, don't try that at home], NASA was reporting that the sunspot cycle was about to come out of its depression, if a newly discovered mechanism for predicting solar cycles — a migrating jet stream deep inside the sun — proved accurate (see National Solar Observatory, NASA say no “Maunder Minimum”).

It now appears TSI is well on its way to recovering, as NASA and others had predicted.  Leif Svalgaard recently put up this figure (click to enlarge):
http://www.leif.org/research/TSI-SORCE-2008-now.png
Spaceweather.com says of its sunspot figure at the top of the page:
The dark line is a linear least-squares fit to the data. If the trend continues exactly as shown (prediction: it won’t), sunspots will become a non-stop daily occurrence no later than February 2011. Blank suns would cease and solar minimum would be over.

If the past two years have taught us anything, however, it is that the sun can be tricky and unpredictable. Stay tuned for surprises.
Even as Solar Cycle 24 picks up, it won’t affect global temperatures quickly.  Again, as  NASA explained in January:
Because of the large thermal inertia of the ocean, the surface temperature response to the 10-12 year solar cycle lags the irradiance variation by 1-2 years. Thus, relative to the mean, i.e., the hypothetical case in which the sun had a constant average irradiance, actual solar irradiance will continue to provide a negative anomaly for the next 2-3 years.
Also, Solar Cycle 24 has recently been predicted to be on the wimpy side.

The sun simply isn’t a big player in driving recent warming.  As a major 2009 study found (see Another long-debunked denier talking point is debunked again: Changes in the Sun are not causing global warming):
According to this analysis, solar forcing contributed negligible long-term warming in the past 25 years and 10% of the warming in the past 100 years.
And a major 2007 study concluded:
Here we show that over the past 20 years, all the trends in the Sun that could have had an influence on the Earth’s climate have been in the opposite direction to that required to explain the observed rise in global mean temperatures.
Related scientific studies on the subject can be found on the excellent debunking website, Skeptical Science.  Here’s but a few:
  • Erlykin 2009: “We deduce that the maximum recent increase in the mean surface temperature of the Earth which can be ascribed to solar activity is 14% of the observed global warming”
  • Benestad 2009: “Our analysis shows that the most likely contribution from solar forcing a global warming is 7 ± 1% for the 20th century and is negligible for warming since 1980.”
  • Lockwood 2008: “It is shown that the contribution of solar variability to the temperature trend since 1987 is small and downward; the best estimate is −1.3% and the 2σ confidence level sets the uncertainty range of −0.7 to −1.9%.”
  • Lockwood 2008: “The conclusions of our previous paper, that solar forcing has declined over the past 20 years while surface air temperatures have continued to rise, are shown to apply for the full range of potential time constants for the climate response to the variations in the solar forcings.”
  • Ammann 2007: “Although solar and volcanic effects appear to dominate most of the slow climate variations within the past thousand years, the impacts of greenhouse gases have dominated since the second half of the last century.”
  • Lockwood 2007: “The observed rapid rise in global mean temperatures seen after 1985 cannot be ascribed to solar variability, whichever of the mechanism is invoked and no matter how much the solar variation is amplified.”
  • Foukal 2006 concludes “The variations measured from spacecraft since 1978 are too small to have contributed appreciably to accelerated global warming over the past 30 years.”
By one recent estimate, human-caused greenhouse gas emissions are responsible for “80 to 120% of the warming” in recent decades (see “What percentage of global warming is due to human causes vs. natural causes?“)

Human-caused emissions are simply driving climate change to dangerous levels with forcings that dwarf previous natural forcings both in speed and scale (see “Humans boosting CO2 14,000 times faster than nature, overwhelming slow negative feedbacks“).

And that’s why the time to act is now, so every decade this century isn’t the hottest decade on record, with unimaginably catastrophic consequences for the health and well-being of our children and grandchildren and their children and grandchildren.

Link: http://climateprogress.org/2009/12/31/science-the-hottest-decade-ends-maunder-mininum-solar-cycle-24-global-warming/

World will warm faster than predicted in next five years, study by Lean and Rind warns

World will warm faster than predicted in next five years, study warns

New estimate based on the forthcoming upturn in solar activity and El Niño southern oscillation cycles is expected to silence global warming sceptics

by Duncan Clark, The Guardian, 27 July 2009

The world faces record-breaking temperatures as the sun's activity increases, leading the planet to heat up significantly faster than scientists had predicted for the next five years, according to a study.

Air temp

The hottest year on record was 1998, and the relatively cool years since have led to some global warming sceptics claiming that temperatures have levelled off or started to decline. But new research firmly rejects that argument.

The research, to be published in Geophysical Research Letters, was carried out by Judith Lean, of the US Naval Research Laboratory, and David Rind, of NASA's Goddard Institute for Space Studies.

The work is the first to assess the combined impact on global temperature of four factors: human influences such as CO2 and aerosol emissions; heating from the sun; volcanic activity and the El Niño southern oscillation, the phenomenon by which the Pacific Ocean flips between warmer and cooler states every few years.

The analysis shows the relative stability in global temperatures in the last seven years is explained primarily by the decline in incoming sunlight associated with the downward phase of the 11-year solar cycle, together with a lack of strong El Niño events. These trends have masked the warming caused by CO2 and other greenhouse gases.

As solar activity picks up again in the coming years, the research suggests, temperatures will shoot up at 150% of the rate predicted by the UN's Intergovernmental Panel on Climate Change. Lean and Rind's research also sheds light on the extreme average temperature in 1998. The paper confirms that the temperature spike that year was caused primarily by a very strong El Niño episode. A future episode could be expected to create a spike of equivalent magnitude on top of an even higher baseline, thus shattering the 1998 record.

The study comes within days of announcements from climatologists that the world is entering a new El Niño warm spell. This suggests that temperature rises in the next year could be even more marked than Lean and Rind's paper suggests. A particularly hot autumn and winter could add to the pressure on policy makers to reach a meaningful deal at December's climate-change negotiations in Copenhagen.

Bob Henson, of the National Centre for Atmospheric Research in Colorado, said: "To claim that global temperatures have cooled since 1998 and therefore that man-made climate change isn't happening is a bit like saying spring has gone away when you have a mild week after a scorching Easter."

Temperature highs and lows

1998

Hottest year of the millennium

Caused by a major El Niño event. The climate phenomenon results from warming of the tropical Pacific and causes heatwaves, droughts and flooding around the world. The 1998 event caused 16% of the world's coral reefs to die.

1957

Most sunspots in a year since 1778

The sun's activity waxes and wanes on an 11-year cycle. The late 1950s saw a peak in activity and were relatively warm years for the period.

1601

Coldest year of the millennium

Ash from the huge eruption the previous year of a Peruvian volcano called Huaynaputina blocked out the sun. The volcanic winter caused Russia's worst famine, with a third of the population dying, and disrupted agriculture from China to France.

Link to article: http://www.guardian.co.uk/environment/2009/jul/27/world-warming-faster-study

Rachel Howe & Frank Hill: Jet streams in the Sun's interior cause sun spots when they reach the critical latitude of 22 degrees

Mystery of the Missing Sunspots, Solved?

06.17.2009

NASA, June 17, 2009: The sun is in the pits of a century-class solar minimum, and sunspots have been puzzlingly scarce for more than two years. Now, for the first time, solar physicists might understand why.

At an American Astronomical Society press conference today in Boulder, Colorado, researchers announced that a jet stream deep inside the sun is migrating slower than usual through the star's interior, giving rise to the current lack of sunspots.

Rachel Howe and Frank Hill of the National Solar Observatory (NSO) in Tucson, Arizona, used a technique called helioseismology to detect and track the jet stream down to depths of 7,000 km below the surface of the sun. The sun generates new jet streams near its poles every 11 years, they explained to a room full of reporters and fellow scientists. The streams migrate slowly from the poles to the equator and when a jet stream reaches the critical latitude of 22 degrees, new-cycle sunspots begin to appear.

see caption

Above: A helioseismic map of the solar interior. Tilted red-yellow bands trace solar jet streams. Black contours denote sunspot activity. When the jet streams reach a critical latitude around 22 degrees, sunspot activity intensifies. [larger image] [more graphics]

Howe and Hill found that the stream associated with the next solar cycle has moved sluggishly, taking three years to cover a 10 degree range in latitude compared to only two years for the previous solar cycle.

The jet stream is now, finally, reaching the critical latitude, heralding a return of solar activity in the months and years ahead.

"It is exciting to see", says Hill, "that just as this sluggish stream reaches the usual active latitude of 22 degrees, a year late, we finally begin to see new groups of sunspots emerging."

The current solar minimum has been so long and deep, it prompted some scientists to speculate that the sun might enter a long period with no sunspot activity at all, akin to the Maunder Minimum of the 17th century. This new result dispells those concerns. The sun's internal magnetic dynamo is still operating, and the sunspot cycle is not "broken."

Because it flows beneath the surface of the sun, the jet stream is not directly visible. Hill and Howe tracked its hidden motions via helioseismology. Shifting masses inside the sun send pressure waves rippling through the stellar interior. So-called "p modes" (p for pressure) bounce around the interior and cause the sun to ring like an enormous bell. By studying the vibrations of the sun's surface, it is possible to figure out what is happening inside. Similar techniques are used by geologists to map the interior of our planet.

In this case, researchers combined data from GONG and SOHO. GONG, short for "Global Oscillation Network Group," is an NSO-led network of telescopes that measures solar vibrations from various locations around Earth. SOHO, the Solar and Heliospheric Observatory, makes similar measurements from Earth orbit.

"This is an important discovery," says Dean Pesnell of NASA's Goddard Space Flight Center. "It shows how flows inside the sun are tied to the creation of sunspots and how jet streams can affect the timing of the solar cycle."

see captionThere is, however, much more to learn.

"We still don't understand exactly how jet streams trigger sunspot production," says Pesnell. "Nor do we fully understand how the jet streams themselves are generated."

To solve these mysteries, and others, NASA plans to launch the Solar Dynamics Observatory (SDO) later this year. SDO is equipped with sophisticated helioseismology sensors that will allow it to probe the solar interior better than ever before.

Right: An artist's concept of the Solar Dynamics Observatory. [more]

"The Helioseismic and Magnetic Imager (HMI) on SDO will improve our understanding of these jet streams and other internal flows by providing full disk images at ever-increasing depths in the sun," says Pesnell.

Continued tracking and study of solar jet streams could help researchers do something unprecedented--accurately predict the unfolding of future solar cycles.

Link to this article: http://science.nasa.gov/headlines/y2009/17jun_jetstream.htm?list173737

SEND THIS STORY TO A FRIEND

Author: Dr. Tony Phillips | Credit: Science@NASA

Anja Eichler et al., Temperature response in the Altai region lags solar forcing

Geophys. Res. Lett., 36, L01808; doi:10.1029/2008GL035930.

Temperature response in the Altai region lags solar forcing

Anja Eichler1,2, Susanne Olivier1,3, Keith Henderson1, Andreas Laube1, Jürg Beer4, Tatyana Papina5, Heinz W. Gäggeler1,3 and Margit Schwikowski1,2

1Paul Scherrer Institute, Villigen, Switzerland.

2Oeschger Centre for Climate Change Research, University of Bern, Bern, Switzerland.

3Department of Chemistry and Biochemistry, University of Bern, Bern, Switzerland.

4Department of Surface Waters, EAWAG, Dübendorf, Switzerland.

5Institute for Water and Environmental Problems, Barnaul, Russia.

Abstract

The role of the sun on Earth's climate variability is still much debated. Here we present an ice core oxygen isotope record from the continental Siberian Altai, serving as a high-resolution temperature proxy for the last 750 years. The strong correlation between reconstructed temperature and solar activity suggests solar forcing as a main driver for temperature variations during the period 1250–1850 in this region. The precisely dated record allowed for the identification of a 10–30 year lag between solar forcing and temperature response, underlining the importance of indirect sun-climate mechanisms involving ocean-induced changes in atmospheric circulation. Solar contribution to temperature change became less important during industrial period 1850–2000 in the Altai region.

(Received 6 September 2008; accepted 5 December 2008; published 15 January 2009.)

Eichler, A., S. Olivier, K. Henderson, A. Laube, J. Beer, T. Papina, H. W. Gäggeler, and M. Schwikowski (2009), Temperature response in the Altai region lags solar forcing, Geophys. Res. Lett., 36, L01808, doi:10.1029/2008GL035930.

Link to abstract: http://www.agu.org/pubs/crossref/2009/2008GL035930.shtml

Anja Eichler: Post 1850 global temperature increases not driven by solar activity

Solar Activity between 1250 and 1850 Linked to Temperature Changes in Siberia

ScienceDaily (Dec. 22, 2008) — An ice core drilled at the Belukha glacier in the Siberian Altai by a Swiss–Russian research team under the leadership of the Paul Scherrer Institute (PSI) in 2001 has now provided new findings in climate research. Oxygen isotopes in the ice were used to reconstruct the temperatures in the Altai over the past 750 years.

The scientists discovered a strong link between regional temperatures and the solar activity in the period 1250–1850, concluding that the sun was an important driver of preindustrial temperature changes in the Altai.

The observation that the reconstructed temperatures followed the solar forcing with a delay of 10–30 years is particularly interesting. The strong rise in temperature in the Altai between 1850 and 2000 can not be explained by solar activity changes, but rather by the increased concentration of the greenhouse gas CO2 in the atmosphere.

The researchers report on these findings in the online edition of the scientific journal Geophysical Research Letters.

The Altai mountains lie on the border between Russia, Kazakhstan, Mongolia, and China, in a region with a particularly pronounced continental climate. In 2001, an international research team under the leadership of Margit Schwikowski (Paul Scherrer Institute) drilled a 139-meter-long ice core at the Belukha glacier, near the highest mountain of the Altai. Following extensive work in the laboratory, this core has now revealed its secrets.

Ice core acting as a thermometer

The ice core was cut into 3600 samples at –20 °C in the PSI’s cold room, and the 16O and 18O oxygen isotope content determined with an isotope mass spectrometer. It was demonstrated that the behaviour of the stable oxygen isotope ratio has closely followed the record of the temperature measured at a nearby weather station over the past 130 years. This parameter can therefore be used as a measure for temperature in the past. The deepest sample was dated to the year 1250, which means that the ice core contains climate information covering the past 750 years.

Solar activity influences temperature

The total solar irradiance is not a constant factor. It fluctuates periodically around a value of 1365 watts per square metre. The best-known cycle has an average duration of 11 years. It has only been possible to measure solar activity directly since 1978, but the number of sun spots – a measure of solar activity – has been observed through telescopes from as far back as the year 1610. Information about the solar activity before that time can be provided by other indirect methods: analysis of the cosmogenic radio-nuclides 10Be from polar ice cores, and 14C from tree rings, which are also dependent on solar activity.

In the period between 1250 and 1850, the regional temperatures in the Altai showed a high correlation with the reconstructed solar activity. This indicates that the changes in solar activity during this time were a main driver of temperature changes.

The temperature follows the sun

Interestingly, the regional temperatures followed the solar forcing with a time lag of 10–30 years. The PSI researchers’ study is the first in which such a delay has been observed over a period of more than 500 years. Since the influence of solar activity on climate has not yet been fully resolved, such observations provide an important contribution to its understanding. One possible mechanism discussed by various authors, which might explain this average lag of 20 years, is the indirect effect of the sun on temperature changes involving ocean-induced changes in atmospheric circulation.

Ocean water warms up to a higher level in places where the solar radiation is most powerful, i.e., in the sub-tropics and the tropics. The heat energy is carried from the lower to the higher latitudes by the ocean, then released back into the atmosphere. Because of the high thermal capacity of the oceans and the variable velocities of their currents, these processes are subject to considerable delay. Changes in the North Atlantic atmospheric circulation system, which is responsible for temperature changes in the Altai, may be initiated 20 years earlier by changes of solar radiation in the tropical oceans.

Strong temperature increase in the 20th century can not be explained by the sun

“Our study distinguishes between the pre-industrial era (1250–1850) and the period covered by the past 150 years,” emphasises Anja Eichler, scientist at the Paul Scherrer Institute. “While changes in the solar activity were a main driver of temperature variations in the pre-industrial period, the temperatures in the Altai have shown a much higher rate of increase than that of solar activity during the past 150 years. The strong increase in the industrial period, however, correlates with the increase in the concentration of the greenhouse gas CO2 over this time. The results of our regional study indicate that changes in solar activity explain less than half of the increase in temperature in the Altai since 1850. This agrees with global studies, based on reconstructed northern hemispheric temperatures,” says the researcher.

This work was undertaken in a collaborative project between the Paul Scherrer Institute and the Eawag–Swiss Federal Institute of Aquatic Science and Technology, the Oeschger Centre for Climate Change Research, and the Department of Chemistry and Biochemistry at the University of Bern, together with the Institute for Water and Environmental Problems at Barnaul (Russia).

A. Eichler, S. Olivier, K. Henderson, A. Laube, J. Beer, T. Papina, H.W. Gäggeler, and M. Schwikowski. Temperature response in the Altai region lags solar forcing. Geophysical Research Letters, 36, L01808; DOI: 10.1029/2008GL035930

Link to article: http://www.sciencedaily.com/releases/2008/12/081219180532.htm