Showing posts with label ENSO. Show all posts

Should The Earth Be Cooling? by Michael Searcy, Skeptical Science

Should The Earth Be Cooling?


Current Climate Running Against the Grain

by Michael Searcy, Skeptical Science, September 17, 2010

When considering whether or not the human influence on the Earth’s climate is discernible, one of the immediate questions that comes to mind is, “What would the climate be doing in the absence of human interference?”

Easterbrook Quote
Indeed all climate models strive to identify the impact of natural mechanisms as compared to anthropogenic, or man-made, ones. The general conclusion has been that models of strictly natural influences do a pretty good job at reproducing real world, pre-industrial climate conditions but that the influence of mankind must be incorporated in order to reproduce the climate conditions of the industrial era. But at what point does the human component overwhelm its natural counterparts, when Mother Nature says we should be going in one direction while reality is going the opposite?

While it’s impossible to know exactly what the climate conditions would be in the absence of mankind, we should be able to get a pretty good sense of at least whether or not the global climate would be warming or cooling. The simplest method to make this determination is by examining the trends of a few major natural mechanisms that influence the climate, namely solar irradiance, the El Niño Southern Oscillation (ENSO), and the Pacific Decadal Oscillation (PDO).

Solar Irradiance, ENSO, and PDO

Shifts in solar irradiance generally follow the Sun’s roughly 11-year sunspot cycle, but the magnitude of these cyclic changes is quite small. However, longer term, multi-decadal trends of rising or declining solar activity can have notable climatic impacts here on Earth. Longer periods of high solar activity or dormancy are often associated with the Medieval Warm Period (MWP) and the Little Ice Age (LIA) respectively.Wolter Quote

ENSO and PDO both refer to oceanic and atmospheric patterns in the Pacific Ocean, but they differ from one another. ENSO focuses on conditions near the equator. These conditions alternate between warmer (El Niño) and colder (La Niña) phases, with individual phases lasting from a few months to a year. Each phase can have a noticeable impact on global temperatures, with El Niño conditions driving temperatures higher and La Niña having the opposite effect. A particularly strong El Niño in 1998 is credited with pushing global temperatures to some of their highest levels on record.

Similar to its equatorial cousin, the northern Pacific PDO alternates between warm and cold phases with a warm PDO encouraging warmer temperatures and a cold PDO the opposite. While its phases are less predictable than ENSO they can last much longer, up to multiple decades.

Examining the Last 30 Years

Spencer QuoteSo what has been going on with these three significant and natural climate drivers, particularly when compared to the warming influence of human industrial carbon dioxide (CO2)? NOAA's National Climatic Data Center (NCDC) states, "The average value of a meteorological element over 30 years is defined as a climatological normal," so let’s examine the current 30-year history of each of these natural mechanisms and their respective influences on the global climate.

Figure 1 below depicts the 30-year trend from 1979 to the present of solar irradiance, ENSO, PDO, and atmospheric carbon dioxide. Each trend has been normalized in order to facilitate comparisons on equivalent scales. Each graph also includes the general warming or cooling influence of the trended data on Earth’s climate. Lastly, the normalized trend of global temperatures over the last 30 years is included.

Climate Forcings (Last 30 Years)
Figure 1. 30-Year Climate Forcings: Solar Irradiance, ENSO, PDO, Atmospheric CO2.


Based on the combination of decreased solar activity, a steady ENSO and a declining PDO over the last 30 years, we would expect to be experiencing a cooling climate. However, despite this opposition from multiple natural factors, global temperatures have risen throughout this time period as the concentration of atmospheric CO2 has escalated. Nature indicates the planet should be cooling. The reality has been just the opposite.

What Do Climate Models Say?

But do the climate models concur with this divergence?

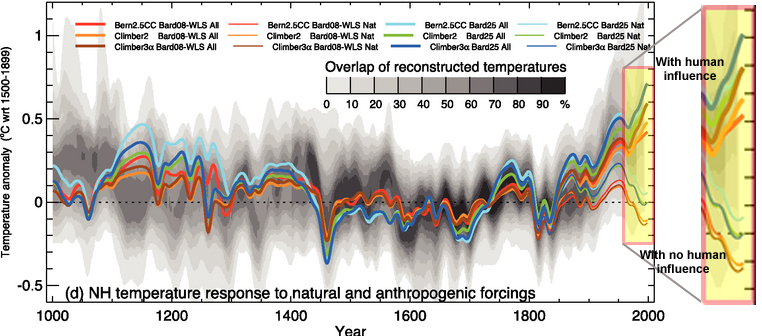
Figure 2 is an excerpt from the IPCC’s 4th Assessment in 2007. Depicted is the output of three climate models. Each model was run reflecting just natural climate influences and also with the inclusion of anthropogenic influences. The different model runs are depicted in color with those reflecting natural+human factors shown in bold. Actual conditions based on direct measurements and proxies are reflected in the background gray range.


Climate Models
Figure 2. Climate models, Figure 6.14, IPCC AR4 WG1 (Click for larger).

Examining the model outputs, as the world enters the industrial age, the models begin to show a split between the results from purely natural influences and those from natural+human factors. However, while the overall trends begin to diverge, the shorter term fluctuations remain in agreement. As the natural result warms, the natural+human result warms. As the natural result cools, the natural+human result cools.

Then things change.

Over the section of the model runs depicting the last 30 years or so, the two model run types diverge completely. While the natural results show a distinct cooling trend in line with the actual observations of solar irradiance, ENSO, and PDO, the results from the natural+human runs show a marked warming trend. This divergence is highlighted in the figure.

Looking at both the actual observations of historically significant climate forcings including solar irradiance, ENSO and PDO and the results from model runs depicting solely natural climate influences, we would expect our planet to be notably cooling.

However, examining climate models including both natural and human influences, we would expect a continued warming trend over the last 30 years.

Which is exactly what's been happening.

Link:  http://www.skepticalscience.com/should_earth_be_cooling.html

James Hansen, Reto Ruedy, Makiko Sato, Ken Lo: If It’s That Warm, How Come It’s So Damned Cold?

If it’s that warm, how come it’s so damned cold?

James Hansen, Reto Ruedy, Makiko Sato, Ken Lo

The past year, 2009, tied as the second warmest year in the 130 years of global instrumental temperature records, in the surface temperature analysis of the NASA Goddard Institute for Space Studies (GISS). The Southern Hemisphere set a record as the warmest year for that half of the world.

Global mean temperature, as shown in Figure 1a, was 0.57 °C (1.0 °F) warmer than climatology (the 1951‐1980 base period). Southern Hemisphere mean temperature, as shown in Figure 1b, was 0.49 °C (0.88 °F) warmer than in the period of climatology.

See link for figures -- sorry I cannot copy them from the pdf file -- drat!!!

http://www.columbia.edu/~jeh1/mailings/2010/20100127_TemperatureFinal.pdf
Figure 1. (a) GISS analysis of global surface temperature change. Green vertical bar is estimated 95% confidence range (two standard deviations) for annual temperature change. (b) Hemispheric
temperature change in GISS analysis. (Base period is 1951–1980. This base period is fixed consistently
in GISS temperature analysis papers – see References. Base period 1961–1990 is used for comparison
with published HadCRUT analyses in Figures 3 and 4.)

The global record warm year, in the period of near‐global instrumental measurements (since the late 1800s), was 2005. Sometimes it is asserted that 1998 was the warmest year.

The origin of this confusion is discussed below.

There is a high degree of interannual (year‐to‐year) and decadal variability in both global and hemispheric temperatures. Underlying this variability, however, is a long‐term warming trend that has become strong and persistent over the past three decades.

The long‐term trends are more apparent when temperature is averaged over several years. The 60‐month (5‐year) and 132 month (11‐year) running mean temperatures are shown in Figure 2 for the globe and the hemispheres. The 5‐year mean is sufficient to reduce the effect of the El Nino–La Nina cycles of tropical climate. The 11‐year mean minimizes the effect of solar variability – the brightness of the sun varies by a measurable amount over the sunspot cycle, which is typically of 10–12 years' duration.

Complete paper at this link: http://www.columbia.edu/~jeh1/mailings/2010/20100127_TemperatureFinal.pdf

PNAS: Tipping Elements in the Earth System: How Stable is the Contemporary Environment?

Tipping Elements in the Earth System: How Stable is the Contemporary Environment?

12/08/2009 – A Special Feature of the “Proceedings of the National Academy of Sciences” presents the latest scientific insights on so-called tipping elements in the planetary environment. These elements have been identified as the most vulnerable large-scale components of the Earth System that may be profoundly altered by human interference. If one or more of those components is tipped – especially in the course of global warming – then the age of remarkably stable environmental conditions on Earth throughout the Holocene may end quickly and irreversibly.
image_miniPNAS Cover image. Images: glacier courtesy of Ulrich Heim (Luebeck, Germany), methane bubbles courtesy of Alfred Wegener Institute, dust cloud courtesy of NASA, and Amazon rainforest courtesy of Greenpeace
This Special Feature of one of the leading research journals in the world was designed and edited by Hans Joachim Schellnhuber of the Potsdam Institute for Climate Impact Research (PIK). It is meant to make a major contribution to the emerging field of sustainability science. The authors involved analyse altogether eight Earth System components. Three of them, the biggest dust source on our planet, oceanic biogeochemical cycles, and marine methane hydrates, are discussed in depth as potential tipping elements for the first time ever.

“It is the cardinal question of Earth System and sustainability science whether global warming actually triggers singular transformations of crucial components of the planetary machinery,” says Schellnhuber. Singular transformations – as opposed to smooth linear and nonlinear ones – would dramatically alter the environment in which human civilisations have developed and thrived over many millennia. “Currently, the climate system still operates in the Holocene mode, but the research presented here underlines that a rise of the global mean temperature beyond two degrees Celsius might push the world into singular-change terrain and therefore needs to be avoided,” Schellnhuber adds.

The PIK scientist has introduced the tipping-elements concept into the research community some ten years ago. It describes components of the Earth System that could be pushed past critical thresholds by anthropogenic forcing, so that they may “tip” into qualitatively different modes of operation. In a recent seminal paper, Tim Lenton from the University of East Anglia, Hans Joachim Schellnhuber and an international group of colleagues presented a formal definition and compiled a short-list of the nine tipping elements ranked as the most policy-relevant (see related Press Release). The current Special Feature examines five of these in much more depth: the El Niño/Southern Oscillation phenomenon, Arctic sea-ice and the great polar ice sheets, the Amazon rainforest, the major monsoon systems, and the circulation of ocean currents in the Atlantic Ocean.

In their article, Matthias Hofmann and Stefan Rahmstorf, also from PIK, discuss the last topic, i.e. the stability properties of the Atlantic Meridional Overturning Circulation (AMOC). The authors present new model simulations of the AMOC response to increased freshwater inflow into the North Atlantic. These challenge the hypothesis that the resulting circulation weakening and the possibility of abrupt oceanic change are just artefacts arising from model flaws. Rather, improving the physical realism of the model leads to a greater vulnerability of the projected AMOC stability.

A group of PIK scientists led by Anders Levermann show that every monsoon circulation inherently bears the possibility of an abrupt collapse. The reason is the moisture-advection feedback which is the core of any monsoon system and was captured in a conceptual model by the authors. The monsoon rains are essential for agriculture as the source of livelihood for several hundred million people in the pertinent regions, the authors state (see related Press Release).

David Archer from the University of Chicago and his co-authors provide evidence that methane hydrates in ocean sediments should be regarded as a “slow tipping element” in the Earth’s climate system. Global warming of some 3 °C could lead to the escape of more than half of the relevant methane stocks, estimated 940 billion tons of carbon, on a millennial time-scale. This hydrate leakage could cause an additional rise in planetary temperature by 0.5 °C. The authors tie this increase in global mean temperature to the methane, but it would persist through many millennia because methane is oxidised in about a decade to carbon dioxide, which continues to impact climate for many millennia.

Ulf Riebesell and colleagues from the Leibniz Institute of Marine Sciences (IFM-GEOMAR) describe the oceans as a climate-system component which is presently undergoing major changes. The sea is not only warming, it is also becoming more acidic. Unbridled anthropogenic emissions of greenhouse gases could alter the cycling of carbon and nutrients in the surface ocean and might damage entire marine ecosystems. The authors conclude that the current level of knowledge allows no clear answer on whether tipping points in the marine ecosphere exist, but they regard some of the projected shifts in oceanic biogeochemistry and their impacts as severe.

Mojib Latif and Noel Keenlyside, also of IFM-GEOMAR, present a review of the complicated mechanisms ruling the El Niño/Southern Oscillation (ENSO) phenomenon. It leads to strong temperature and precipitation fluctuations in the Equatorial Pacific from one year to another and has widespread effects on the global climate system. However, current climate models cannot capture the potential tipping point behaviour of the ENSO phenomenon, the authors resume. Given the potentially huge impacts on biological, chemical and socio-economic systems, the question whether global warming will fundamentally alter the ENSO dynamics in the future has to be investigated further.
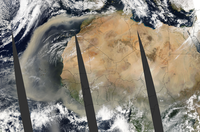
image_mini2Tipping element Bodélé Depression: The immense dust storm was imaged in a series of overpasses by the NASA’s Aqua satellite. Image courtesy Jacques Descloitres, MODIS Rapid Response Team, NASA-Goddard Space Flight Center
A research team led by Richard Washington from the University of Oxford qualifies the biggest dust source on our planet, the Bodélé Depression in Chad, as a potential tipping element. This area in the southern Sahara releases huge plumes, which carry about 700,000 tons of dust towards the Atlantic and the Amazon basin. The authors explain that the so-deployed mineral aerosols play a vital role in transcontinental climatic and biophysical feedbacks. If regional wind patterns or surface erosivities changed due to anthropogenic interference, the dust export from the Bodélé Depression could be substantially modified at time scales as small as one season.

A research team headed by Yadvinder Malhi, also of the University of Oxford, has employed nineteen different global climate models to investigate, whether climate change could cause a large-scale dieback of Amazonian rainforest. The analysis based on a scenario with continuously increasing global emissions of greenhouse gases over the 21st century suggests that dry season water stress is likely to increase in parts of Amazonia. The researchers provide evidence that the Amazonian rainforest could reveal characteristic properties of a tipping element with the tendency to change into a seasonal forest.

In his paper on potential threshold behaviour of sea-ice and continental ice-sheets, Dirk Notz of the Max Planck Institute for Meteorology concludes that tipping points more likely exist for the loss of the Greenland ice sheet and the West-Antarctic ice sheet than for the loss of Arctic sea-ice, which could recover rapidly in a cooler climate. Inland ice could be much more vulnerable to regional warming due to the lack of large internal stabilizing feedbacks as existing for the Arctic sea-ice dynamics. Melting of the continental ice-sheets could lead to rapid multi-meter rise in mean sea level over the coming centuries.

Finally, Nobel Laureate Mario Molina and his co-authors demand fast action from political and economic decision makers to avoid activation of tipping elements. They propose to strengthen the Montreal Protocol regarding substances that have high global-warming potentials. In particular, the scientists make strong cases for an accelerated phasing out of hydrochlorofluorocarbons and a massive reduction of the emissions of soot.
“After two decades of failed climate protection since the 1990 IPCC Report it is more doubtful than ever whether society will manage to confine global environmental change to sub-dangerous levels,” says Hans Joachim Schellnhuber. The tipping-elements field is developing quickly into a broad and relevant research frontier domain, but the issues pose tough challenges for contemporary science. Practically none of the planetary cases studied can be either dismissed now – by firmly ruling out a possible anthropogenic triggering of irregular dynamics – or settled by providing reliable estimates for activation temperatures and reaction time scales. “Many of the papers sketch the research way forward, but it seems that we will have to live with at least another decade of tantalising ignorance concerning the most worrying potential impacts of global warming,” says Schellnhuber.

Article: Hans Joachim Schellnhuber (2009) Tipping Elements in Earth Systems Special Feature: Tipping elements in the Earth System. PNAS published online before print December 7, 2009, doi:10.1073/pnas.0911106106

Further reading:
Related Press Release by the Institute for Governance & Sustainable Development http://igsd.org/documents/PR_PNASSpecialFeature_7Dec09.pdf (pdf-file, 67 KB)

Michael E. Mann et al., Science 326 (2009), Global signatures and dynamical origins of the Little Ice Age and Medieval Climate Anomaly

Science (27 November 2009), Vol. 326, No. 5957, pp. 1256-1260; DOI: 10.1126/science.1177303

Global Signatures and Dynamical Origins of the Little Ice Age and Medieval Climate Anomaly

Michael E. Mann,1,* Zhihua Zhang,1 Scott Rutherford,2 Raymond S. Bradley,3 Malcolm K. Hughes,4 Drew Shindell,5 Caspar Ammann,6 Greg Faluvegi,5 and Fenbiao Ni4 

Abstract

Global temperatures are known to have varied over the past 1500 years, but the spatial patterns have remained poorly defined. We used a global climate proxy network to reconstruct surface temperature patterns over this interval. The Medieval period is found to display warmth that matches or exceeds that of the past decade in some regions, but which falls well below recent levels globally. This period is marked by a tendency for La Niña–like conditions in the tropical Pacific. The coldest temperatures of the Little Ice Age are observed over the interval 1400 to 1700 C.E., with greatest cooling over the extratropical Northern Hemisphere continents. The patterns of temperature change imply dynamical responses of climate to natural radiative forcing changes involving El Niño and the North Atlantic Oscillation–Arctic Oscillation.

*Correspondence e-mail: mann@meteo.psu.edu

Link to abstract:  http://www.sciencemag.org/cgi/content/short/326/5957/1256

World Meteorological Organization: 2000–2009, THE WARMEST DECADE

Press Release No. 869

For use of the information media
Not an official record


2000–2009, THE WARMEST DECADE

Geneva, 8 December 2009 (WMO) – The year 2009 is likely to rank in the top 10 warmest on record since the beginning of instrumental climate records in 1850, according to data sources compiled by the World Meteorological Organization (WMO). The global combined sea surface and land surface air temperature for 2009 (January–October) is currently estimated at 0.44°C ± 0.11°C (0.79°F ± 0.20°F) above the 1961–1990 annual average of 14.00°C/57.2°F. The current nominal ranking of 2009, which does not account for uncertainties in the annual averages, places it as the fifth-warmest year. The decade of the 2000s (2000–2009) was warmer than the decade spanning the 1990s (1990–1999), which in turn was warmer than the 1980s (1980–1989). More complete data for the remainder of the year 2009 will be analysed at the beginning of 2010 to update the current assessment.

This year above-normal temperatures were recorded in most parts of the continents. Only North America (United States and Canada) experienced conditions that were cooler than average. Given the current figures, large parts of southern Asia and central Africa are likely to have the warmest year on record.

Climate extremes, including devastating floods, severe droughts, snowstorms, heatwaves and cold waves, were recorded in many parts of the world. This year the extreme warm events were more frequent and intense in southern South America, Australia and southern Asia, in particular. La Niña conditions shifted into a warm-phase El Niño-Southern Oscillation (ENSO) in June. The Arctic sea ice extent during the melt season ranked the third lowest, after the lowest and second-lowest records set in 2007 and 2008, respectively.

This preliminary information for 2009 is based on climate data from networks of land-based weather and climate stations, ships and buoys, as well as satellites. The data are continuously collected and disseminated by the National Meteorological and Hydrological Services (NMHSs) of the 189 Members of WMO and several collaborating research institutions. The data continuously feed three main depository global climate data and analysis centres, which develop and maintain homogeneous global climate datasets based on peer-reviewed methodologies. The WMO global temperature analysis is thus based on three complementary datasets. One is the combined dataset maintained by both the Hadley Centre of the UK Met Office and the Climatic Research Unit, University of East Anglia, United Kingdom. Another dataset is maintained by the National Oceanic and Atmospheric Administration (NOAA) under the United States Department of Commerce, and the third one is from the Goddard Institute of Space Studies (GISS) operated by the National Aeronautics and Space Administration (NASA). The content of the WMO statement is verified and peer-reviewed by leading experts from other international, regional and national climate institutions and centres before its publication.

Final updates and figures for 2009 will be published in March 2010 in the annual WMO Statement on the Status of the Global Climate.

Regional temperature anomalies
The year 2009 (January–October) was again warmer than the 1961–1990 average all over Europe and the Middle East. China had the third-warmest year since 1951; for some regions 2009 was the warmest year. The year started with a mild January in northern Europe and large parts of Asia, while western and central Europe were colder than normal. Russia and the Great Lakes region in Canada experienced colder-than- average temperatures in February and January, respectively. Spring was very warm in Europe and Asia; April in particular was extremely warm in central Europe. Germany, the Czech Republic and Austria reported temperature anomalies of more than +5°C, breaking the previous records for the month in several locations.

The European summer was also warmer than the long-term average, particularly over the southern regions.

Spain had the third-warmest summer, with hotter summers reported only in 2003 and 2005. Italy recorded a strong heatwave in July, with maximum temperatures above 40°C, and some local temperatures reaching 45°C. A heatwave at the beginning of July affected the United Kingdom, France, Belgium and Germany, and some stations in Norway experienced new maximum temperature records.

India had an extreme heatwave event during May, which caused 150 deaths. A heatwave hit northern China during June, with daily maximum temperatures above 40°C; historical maximum temperature records were broken for the summer in some locations.

In late July many cities across Canada recorded their warmest daily temperatures. Vancouver and Victoria set new records, reaching 34.4°C and 35.0°C, respectively. Alaska also had the second-warmest July on record. Conversely, October was a very cold month across large parts of the United States. For the nation as a whole, it was the third-coolest October on record, with an average temperature anomaly of -2.2°C (-4.0°F). Similarly, a very cold October was reported in Scandinavia, with mean temperature anomalies ranging from -2°C to -4°C.

The austral autumn (March to May) was extremely warm in Argentina, Uruguay, Paraguay and southern Brazil. With daily temperatures ranging from 30°C to 40°C, several records were broken during this season. By the end of October, an extreme weather situation affected north and central Argentina, producing unusually high temperatures (above 40°C). Conversely, November was abnormally cold in the southern part of the region, with some rare and late snowfalls.

So far, Australia has had the third-warmest year on record. The year 2009 was marked by three exceptional heatwaves, which affected south-eastern Australia in January/February and November, and subtropical eastern Australia in August. The January/February heatwave was associated with disastrous bushfires that caused more than 173 fatalities. Victoria recorded its highest temperature with 48.8°C. The northern region experienced a cold summer, however, with anomalies reaching -3°C to -4°C in some places. Winter was exceptionally mild over much of Australia. Maximum temperatures were well above normal across the entire continent, reaching 6°C to 7°C above normal in some parts. The national maximum temperature anomaly of +3.2°C was the largest ever recorded for any month.

Severe droughts
China suffered its worst drought in five decades. Water levels in parts of the Gan River and Xiangjiang River were the lowest in the past 50 years. In India the poor monsoon season caused severe drought impacts in 40 per cent of the districts. The north-western and north-eastern parts of the country were badly affected. It was reported to be one of the weakest monsoon seasons since 1972.

In East Africa the drought led to massive food shortages. In Kenya the drought was responsible for severe damage to livestock and a 40% decline in the maize harvest.

In North America, Mexico experienced severe-to-exceptional drought conditions by the month of September. In the United States, the western region was the most affected by a moderate-to-exceptional drought by the end of October. Nevertheless, the total area affected by drought in the United States during October was the second-smallest value recorded in this decade.

Drought in Central Argentina caused severe damage to agriculture, livestock and water resources. The situation was most severe at the end of October, with very high temperatures reported as well.

Over the key agricultural areas of the Murray-Darling Basin and the south-western part of Western Australia, rainfall was generally below normal. The passage of another year without any sustained above-normal rainfall has seen long-term rainfall deficits continuing in south-eastern Australia. Sustained dry conditions in the Murray-Darling Basin have now continued for nine years.

Intense storm events and precipitation
At the end of January, Spain and France were severely affected by winter storm Klaus, the worst extra-tropical storm in a decade, with winds similar to a category 3 hurricane. Another winter storm combined with heavy snowfall caused severe damage in western Europe and resulted in serious disruptions of air and rail traffic in several countries. In late spring and summer a large number of thunderstorms with heavy rain, hail and tornadoes caused local flooding and significant damage across Germany. In September, several parts of the Mediterranean region were affected by extreme rainfall events. Total rainfall of more than 300mm was recorded in less than 48 hours in one location of south-eastern Spain, where the long-term average for total annual precipitation does not exceed 450 mm. During the same month, intense rainfall caused devastating damage to infrastructure in several parts of northern Africa, including Algeria, Morocco and Tunisia. In a similar pattern, the highest September rainfall recorded in 80 years produced severe flash floods in north-western Turkey. November brought severe flooding to northern areas of the United Kingdom, and a new 24-hour precipitation record was set for the country.

During the beginning of the year heavy rainfall was observed in Colombia, producing landslides and widespread floods. North-east Brazil was severely affected by heavy rainfall and flooding in April and May. Later, in July, a severe snowstorm hit the southern part of Argentina; it was the worst snowstorm in 15 years. During the austral spring, particularly in November, continuous heavy and intense rainfall was seen in north-eastern Argentina, southern Brazil and Uruguay, causing flooding in many places and affecting more than 15,000 people. Total monthly precipitation records were broken, with rainfall exceeding more than 500mm in many locations.

In Canada, Ontario experienced a record number of witnessed tornadoes and a record number of related fatalities. Canadian avalanches were almost double the yearly average for the past decade and the worst since 2002–2003. A total of 25 deaths made it one of the deadliest seasons. The northern plains region of the United States was affected by record flooding during the month of March. As a whole, the United States recorded the wettest October in 115 years.

In Central America, an intense storm in El Salvador in November, associated in part with Hurricane Ida, produced deadly floods and landslides that claimed 192 lives.

In Asia, after the weak 2009 monsoon season, southern India recorded severe flooding due to incessant rain in late September and the first week of October, and more than 250 lives were lost. On the other hand, northern China was severely affected by a snowstorm that occurred during the first half of November as part of a strong cold wave. These snowfalls were one month earlier than normal, breaking local weather records.

In western Africa, heavy and intense rainfall in September caused flooding that affected more than 100,000 people. The worst flooding was observed in Burkina Faso, where 263 mm of rain was recorded in less than 12 hours, breaking a record set 90 years ago. Further south on the continent, nearly 1 million people in Zambia and Namibia were affected by torrential rain that caused rivers to overflow their banks, flooding homes and cropland.

Australia was also affected by local flooding. Coastal Queensland and New South Wales were the hardest hit by several heavy rain events, with daily rainfall totals in excess of 300 mm. On the other hand, numerous duststorms affected eastern Australia in the second half of September and early October, as regular strong winds transported dust from northern South Australia over the eastern states. The most severe duststorm occurred on 22–23 September and covered large parts of New South Wales and Queensland, where the visibility was reduced to 100–200m in both Sydney and Brisbane.

End of La Niña and Development of El Niño
La Niña-like conditions were present in early 2009, followed by the development of El Niño patterns starting in June 2009. During June–September 2009, sea surface temperatures were generally about 1°C warmer than the long-term average across the central and eastern equatorial Pacific. An El Niño event is currently underway, with the early phase of the event holding steady at weak-to-moderate levels through July–September. During October, almost all indicators of El Niño became noticeably stronger.

Tropical cyclone season
The 2009 Atlantic hurricane season closed with the fewest named storms and hurricanes since 1997, most likely due to the unfavourable cyclonic conditions caused in part by El Niño. A total of nine named tropical storms were formed, including three hurricanes, two of which were major hurricanes at Category 3 strength or higher. (The averages are 11, 6 and 2, respectively).

In the East Pacific, 20 named tropical storms were recorded, eight of which evolved into hurricanes and five of which became major hurricanes (The averages are 16, 9 and 4, respectively.)

In the western North Pacific, 22 named tropical storms have been recorded so far, and 13 of them reached the intensity of typhoon, compared to the long-term averages of 27 and 14, respectively. Heavy precipitation associated with typhoons Ketsana and Parma was observed across the south of Luzon Island in the Philippines. The resulting flood disaster caused more than 900 fatalities in total. In August, Typhoon Morakot swept across Taiwan Province of China and caused more than 400 deaths and severe damage to agriculture and infrastructure. Hundreds of roads and bridges on the island were destroyed by floods.

The Australian and South Indian Ocean cyclone seasons recorded near-average activity. In the Australian region, there were 10 systems during this season, with Hamish the most significant one, although it did not make landfall. It reached category 5 intensity and was the most intense cyclone observed off the eastern Queensland coast since 1918.

Third-lowest Arctic sea ice
According to scientific measurements, Arctic sea ice has declined dramatically over the past 30 years at least, with the most extreme decline seen in the summer melt season. Arctic sea ice extent during the 2009 melt season was 5.10 million km2, which is the third-lowest on record after the 2007 record (4.3 million km2) and 2008 (4.67 million km2), since satellite measurements began in 1979.

Seth Borenstein: Global cooling rejected by statisticians

Statisticians reject global cooling

Some skeptics claim Earth is cooling despite contrary data

by Seth Borenstein, AP Science Writer, October 26, 2009


WASHINGTON - An analysis of global temperatures by independent statisticians shows the Earth is still warming and not cooling as some global warming skeptics are claiming.

The analysis was conducted at the request of The Associated Press to investigate the legitimacy of talk of a cooling trend that has been spreading on the Internet, fueled by some news reports, a new book and temperatures that have been cooler in a few recent years.

In short, it is not true, according to the statisticians who contributed to the AP analysis.

The statisticians, reviewing two sets of temperature data, found no trend of falling temperatures over time.

2005 hottest year recorded

U.S. government data show the decade that ends in December will be the warmest in 130 years of record-keeping, and 2005 was the hottest year recorded.

The case that the Earth might be cooling partly stems from recent weather. Last year was cooler than previous years. It has been a while since the superhot years of 1998 and 2005. So is this a longer climate trend or just weather's normal ups and downs?

In a blind test, the AP gave temperature data to four independent statisticians and asked them to look for trends, without telling them what the numbers represented. The experts found no true temperature declines over time.

"If you look at the data and sort of cherry-pick a microtrend within a bigger trend, that technique is particularly suspect," said John Grego, a professor of statistics at the University of South Carolina.

Yet the idea that things are cooling has been repeated in opinion columns, a BBC news story posted on the Drudge Report and in a new book by the authors of the best-seller "Freakonomics." Last week, a poll by the Pew Research Center found that only 57% of Americans now believe there is strong scientific evidence for global warming, down from 77% in 2006.

Global warming skeptics base their claims on an unusually hot year in 1998. Since then, they say, temperatures have dropped — thus, a cooling trend. But it is not that simple.

Temps rising once more

Since 1998, temperatures have dipped, soared, fallen again and are now rising once more. Records kept by the British meteorological office and satellite data used by climate skeptics still show 1998 as the hottest year. However, data from the National Oceanic and Atmospheric Administration and NASA show 2005 has topped 1998. Published peer-reviewed scientific research generally cites temperatures measured by ground sensors, which are from NOAA, NASA and the British, more than the satellite data.

The recent Internet chatter about cooling led NOAA's climate data center to re-examine its temperature data. It found no cooling trend.

"The last 10 years are the warmest 10-year period of the modern record," said NOAA climate monitoring chief Deke Arndt. "Even if you analyze the trend during that 10 years, the trend is actually positive, which means warming."

The AP sent expert statisticians to analyze NOAA's year-to-year ground temperature changes over 130 years and the 30 years of satellite-measured temperatures preferred by skeptics and gathered by scientists at the University of Alabama in Huntsville.

Statisticians who analyzed the data found a distinct decades-long upward trend in the numbers, but could not find a significant drop in the past 10 years in either data set. The ups and downs during the last decade repeat random variability in data as far back as 1880.

Saying there's a downward trend since 1998 is not scientifically legitimate, said David Peterson, a retired Duke University statistics professor and one of those analyzing the numbers.

Identifying a downward trend is a case of "people coming at the data with preconceived notions," said Peterson, author of the book "Why Did They Do That? An Introduction to Forensic Decision Analysis."

Satellite data tends to be cooler

One prominent skeptic said that to find the cooling trend, the 30 years of satellite temperatures must be used. The satellite data tends to be cooler than the ground data. Key to that is making sure that 1998 is part of the trend, he added.

What happened within the past 10 years or so is what counts, not the overall average, contends Don Easterbrook, a Western Washington University geology professor and global warming skeptic.

"I don't argue with you that the 10-year average for the past 10 years is higher than the previous 10 years," said Easterbrook, who has self-published some of his research. "We started the cooling trend after 1998. You're going to get a different line depending on which year you choose.

"Should not the actual temperature be higher now than it was in 1998?" Easterbrook asked. "We can play the numbers games."

That's the problem, some of the statisticians said.

Grego produced three charts to show how choosing a starting date can alter perceptions. Using the skeptics' satellite data beginning in 1998, there is a "mild downward trend," he said. But doing that is "deceptive."

Conflicting data analyses

The trend disappears if the analysis is begun in 1997. And it trends upward if you begin in 1999, he said.
Apart from the conflicting data analyses is the eyebrow-raising new book title from Steven D. Levitt and Stephen J. Dubner, "Super Freakonomics: Global Cooling, Patriotic Prostitutes and Why Suicide Bombers Should Buy Life Insurance."

A line in the book says: "Then there's this little-discussed fact about global warming: While the drumbeat of doom has grown louder over the past several years, the average global temperature during that time has in fact decreased."

That led to a sharp rebuke from the Union of Concerned Scientists, which said the book mischaracterizes climate science with "distorted statistics."

Levitt, a University of Chicago economist, said he does not believe there is a cooling trend. He said the line was just an attempt to note the irony of a cool couple of years at a time of intense discussion of global warming. Levitt said he did not do any statistical analysis of temperatures but "eyeballed" the numbers and noticed 2005 was hotter than the last couple of years. Levitt said the "cooling" reference in the book title refers more to ideas about trying to cool the Earth artificially.

Moving averages over 10 years important

Statisticians say that in sizing up climate change, it's important to look at moving averages of about 10 years. They compare the average of 1999-2008 to the average of 2000-2009. In all data sets, 10-year moving averages have been higher in the last five years than in any previous years.

"To talk about global cooling at the end of the hottest decade the planet has experienced in many thousands of years is ridiculous," said Ken Caldeira, a climate scientist at the Carnegie Institution at Stanford University.
Ben Santer, a climate scientist at the Department of Energy's Lawrence Livermore National Lab, called it "a concerted strategy to obfuscate and generate confusion in the minds of the public and policy-makers" ahead of international climate talks in December in Copenhagen.

President Barack Obama weighed in on the topic Friday at the Massachusetts Institute of Technology. He said some opponents "make cynical claims that contradict the overwhelming scientific evidence when it comes to climate change, claims whose only purpose is to defeat or delay the change that we know is necessary."
Early this year, climate scientists in two peer-reviewed publications statistically analyzed recent years' temperatures against claims of cooling and found them invalid.

Not all skeptical scientists make the flat-out cooling argument.

"It pretty much depends on when you start," wrote John Christy, the Alabama atmospheric scientist who collects the satellite data that skeptics use. He said in an e-mail that looking back 31 years, temperatures have gone up nearly 0.75 °F (0.4 °C). The last dozen years have been flat, and temperatures over the last eight years have declined a bit, he wrote.

Oceans influence short-term weather

Oceans, which take longer to heat up and longer to cool, greatly influence short-term weather, causing temperatures to rise and fall temporarily on top of the overall steady warming trend, scientists say. The biggest example of that is El Nino.

El Nino, a temporary warming of part of the Pacific Ocean, usually spikes global temperatures, scientists say. The two recent warm years, both 1998 and 2005, were El Nino years. The flip side of El Nino is La Nina, which lowers temperatures. A La Nina bloomed last year and temperatures slipped a bit, but 2008 was still the ninth hottest in 130 years of NOAA records.

Of the 10 hottest years recorded by NOAA, eight have occurred since 2000, and after this year it will be nine because this year is on track to be the sixth-warmest on record.

The current El Nino is forecast to get stronger, which probably will pushing global temperatures even higher next year, scientists say. NASA climate scientist Gavin Schmidt predicts 2010 may break a record, so a cooling trend "will be never talked about again."

Joseph Romm: NASA reports hottest June to September on record*; NOAA says “weak” El Niño “expected to strengthen and last through” winter

NASA reports hottest June to September on record*; NOAA says “weak” El Niño “expected to strengthen and last through” winter

by Joseph Romm, Climate Progress blog, October 13, 2009
 
Fast on the heels of the second warmest August on record and warmest June-July-August for the oceans, NASA’s Goddard Institute for Space Studies reports that this was the second hottest September on record.
Unlike NOAA, which will announce its September global analysis in a few days, NASA just quietly updates its data set (here).  So you have to do a little math to see that for the June through September period, 2009 now tops both 2005 and 1998.  I put the asterisk in the headline since these four months in 2009 are only slightly warmer than those in 1998.

I’m not cherry-picking these last four months, but rather ENSO-picking them.  The reason 1998 was so anomalously warm even beyond the human-caused trend was the uber-El Niño.  Back in January, NASA had predicted:  “Given our expectation of the next El Niño beginning in 2009 or 2010, it still seems likely that a new global temperature record will be set within the next 1-2 years, despite the moderate negative effect of the reduced solar irradiance.”

Then, back in early June NOAA put out “El Niño Watch,” which I noted meant that “record temperatures are coming and this will be the hottest decade on record.”  So here we are.

What makes these record temps especially impressive is that we’re at “the deepest solar minimum in nearly a century,” according to NASA.  It’s just hard to stop the march of anthropogenic global warming, well, other than by reducing GHG emissions, that is.

Another thing that makes these record temps impressive is that we’re only in a “weak El Niño,” according to the latest monthly “El Niño/Southern oscillation (ENSO) Diagnostic Discussion” of the Climate Prediction Center of NOAA’s National Weather Service:

Synopsis: El Niño is expected to strengthen and last through the Northern Hemisphere winter 2009-2010.

A weak El Niño continued during September 2009, as sea surface temperature (SST) anomalies remained nearly unchanged across much of the equatorial Pacific Ocean (Figs. 1 & 2). Since the transition to El Niño conditions during June, the weekly values of the Niño-3.4 index have remained between +0.7°C and +0.9°C (Fig. 2). Subsurface oceanic heat content (average temperatures in the upper 300m of the ocean, Fig. 3) anomalies continued to reflect a deep layer of anomalous warmth between the ocean surface and the thermocline, particularly in the central and east-central Pacific (Fig. 4)….  These oceanic and atmospheric anomalies reflect an ongoing weak El Niño.
A majority of the model forecasts for the Niño-3.4 SST index (Fig. 6) suggest that El Niño will reach at least moderate strength during the Northern Hemisphere fall (3-month Niño-3.4 SST index of +1.0°C or greater). Many model forecasts even suggest a strong El Niño (3-month Niño-3.4 SST index in excess of +1.5°C) during the fall and winter, but in recent months some models, including the NCEP CFS, have over-predicted the degree of warming observed so far in the Niño-3.4 region (Fig. 7). Based on the model forecasts, the seasonality of El Niño, and the continuation of westerly wind bursts, El Niño is expected to strengthen and most likely peak at moderate strength.
ENSO 9-09
What is particularly interesting to me is the prediction that, while his is not going to be a blockbuster El Niño in terms of amplitude, as we saw in 1997-1998, it may turn out to be a pretty long one.  If it lasts through June 2010, then that year seems poised to be the hottest on record.
Related Post:
Link to Climate Progress blog:  http://climateprogress.org/2009/10/13/nasa-hottest-june-to-september-on-record-noaa-weak-el-nino-is-expected-to-strengthen/

Of moles and whacking: “Mojib Latif predicted two decades of cooling” [Tenney here: NOT!]

Of moles and whacking: “Mojib Latif predicted two decades of cooling” [Tenney here:  NOT!]

The Way Things Break blog, September 11, 2009 · 59 Comments

Or: Journalists should report what climate science actually “says”, rather than what they mistakenly “believe” it to say – Part II

In Part I we looked at some issues relating to climate science that the Houston Chronicle’s “SciGuy” Eric Berger was mistaken about and had blamed “climate scientists” for. And while pointing out that it isn’t particularly fair for Mr. Berger to blame climate scientists for his misunderstandings, it would also be unfair to say that his confusion was his fault alone.

Fred Pearce wrote a recent column for New Scientist claiming climate modeler Mojib Latif predicted that up to two decades of cooling were coming: “We could be about to enter one or even two decades of cooler temperatures, according to one of the world’s top climate modellers.” Pearce’s claim was promptly picked up by the denialosphere and has been cited by “skeptics” as well as those who believe climate science is undergoing some sort of shake up, like Mr. Berger. Pearce’s story is greatly misleading both in terms of what Latif actually said and the role climate scientists believe natural variability plays in the climate system.

First a bit of background: Pearce’s story was written about a recent climate summit: the World Climate Conference-3. Part of the summit was dedicated to Advancing Climate Prediction Science; Latif’s presentation was concerned with decadal-scale climate predictions -- concerning not only their potential value and viability but also the significant challenges that remain before we can make useful ones.

On interannual (more than a single year) and decadal (tens of years) scales, natural variability swamps the long term anthropogenic warming trend. That is to say that variations in naturally occurring aspects of the climate system have more of an impact on the ultimate value of, say, global average temperature over a span of 10 or so years than man-made global warming does. For example, changes in ENSO are one of the largest sources of natural variability and thus influence on global average temperatures in the climate system on interannual scales. In 1998, a very strong El Niño boosted the global average temperature much higher than the overall trend, while in 2008, a persistent La Niña in cahoots with a solar minimum ensured that temperature was in the top 10 (#9 for NASA, #10 for Met Hadley) hottest years on record, but not a record breaker.
While this might be surprising for some readers, let’s be clear: This is not “new” information. This does not represent a “shake up” of the climate science community’s understanding of the system, or a blow to “settled science.” This is acknowledged in the IPCC’s most recent Assessment Report (AR4 WG1 8.3 and 9.4) as well as in the relevant primary literature. For example, the AR4 Synthesis Report states:
On scales [smaller than 50 years], natural climate variability is relatively larger [than human influences], making it harder to distinguish changes expected due to external [e.g., man-made] forcings.
Latif begins the section of his presentation misrepresented by Pearce by confirming that the media incorrectly believes that global warming is monotonic- something that we know the warming is decidedly not; something not claimed by “climate science” or “climate scientists.” Significant natural variability is superimposed on the long term man-made warming trend. Although the press might expect for us to set a new temperature record every year, the existence of natural variability means that we could in theory wait a long time (~17 years) before setting a new temperature record. Latif imagines ‘what if’:
It may well happen that you enter a decade, or maybe even two -- you know -- when the temperature cools -- all right -- relative to the present level -- all right?

And then -- you know -- I know what’s going to happen -- you know? I will get -- you know -- millions of phone calls -- you know:
“Eh, what’s going on? So, is global warming disappearing?” You know? “Have you lied on [sic] us?”
So -- you know -- and therefore this is the reason why we need to address this decadal prediction issue.
[ed. note: "entering... two [decades]” depending on the usage can take as little as 11 years, “enter[ing]” a decade” as little as one]

This was not an explicit prediction by Latif -- it was a hypothetical scenario that is a real, if  not necessarily likely, possibility. Latif is saying that because people don’t understand that global warming isn’t supposed to be monotonic, and that there could be periods where temperatures pause or even dip below the present, the media and/or public will incorrectly believe that global warming has stopped/was wrong, etc., even though such “pauses” in warming are decidedly not contrary to our understanding of the climate system and how we anticipate it will respond to emissions driven warming.

Of course this is like cat nip to the denialists and their fellow travelers like Roger Pielke Jr. It feeds into the caricature, enabled by sloppy journalism, that nearly everything can happen because of global warming [often phrased, "Global warming, is there anything it can't do?" Sometimes with 'global warming' stricken out and replaced with 'climate change'].

Latif goes on to describe a number of phenomena that have an overall trend but are dominated on the interannual and even decadal scales by natural variability: Sahel rainfall, Atlantic tropical cyclones, regional sea levels. Again, none of this is new, none of it was presented as new. This represents no paradigm shift within climate science.

Latif then switches gears to model initialization. When the IPCC offers projections of global temperature change into the next 100 years, these are not predictions- as previously discussed. And dealing with interannual or decadal predictions instead of looking at the changes to temperature trends 100 years out is a difference between an initial value problem and a boundary value (or in Latif’s words, a “boundary force”) problem. Uncertainties about emissions scenarios (how much carbon we decide to burn) and model biases are the dominant areas of uncertainty for end-of-century projections of changes of how temperature will trend.

However, on much shorter scales, such as interannual or decadal scales, can you guess what the largest source of uncertainty becomes? Yep, that’s right, natural variability. Prediction on such short timescales then becomes at least partially an initial value problem. Latif rightly understands that such short term predictions depend on accurate understanding and modeling of initialization factors like variance in the North Atlantic Oscillation. You might remember when a team he was part of made some waves in predicting a temporary pause in warming/global cooling in their attempt to initialize a climate model to make a deliberate prediction (rather than say an end-of-century projection) of temperature for the next few decades. Suffice it to say that not everyone has found the basis of their prediction (of no immediate warming) particularly compelling.
Latif’s warning, garbled though it became regarding the reality and difficulty in predicting natural variability, deserves to be acknowledged. It’s exceedingly difficult for me to see, however, how or why the presentation was subsequently spun in the manner that it was, or why science journalists like Mr. Berger would accept said spin so uncritically.

Pearce’s article gives the false impression that there is a “new” or “growing” dissent from the broad strokes consensus on climate change. This couldn’t be further from the truth. I appreciate Pearce’s concern (that the existence of natural variability can embolden denialists), but it sounds like this concern has caused him to unnecessarily and inaccurately frame Latif’s presentation as a challenge to the scientific consensus on climate change. Natural variability is of course real. It can and will overwhelm man-made warming on shorter timescales. That journalists are beginning to pay attention to this simple fact is not a reflection of a sea change in our understanding of climate science.

Latif’s presentation and audio [LATE UPDATE: The audio has moved, it's now here under "Advancing Climate Prediction Science"; the presentation is available here] are available for anyone to examine. We can look at Mr. Berger and others’ claims about hurricanes/tropical cyclones and anthropogenic warming in a Part III, if there is interest.

[Fixed some spelling errors and reworded the penultimate paragraph for clarity]
Link to The Way Things Break blog post:  http://thingsbreak.wordpress.com/2009/09/11/of-moles-and-whacking-mojib-latif-predicted-two-decades-of-cooling/

Steiner, Kirchengas, Lackner, Pirscher, Borsche, Foelsche, GRL 2009, Atmospheric temperature change detection with GPS radio occultation 1995-2008

Geophysical Research Letters, 36 (2009)  L18702; doi: 10.1029/2009GL039777.

Atmospheric temperature change detection with GPS radio occultation 1995 to 2008

A. K. Steiner, G. Kirchengas, B. C. Lackner, B. Pirscher, M. Borsche, and U. Foelsche (Wegener Center for Climate and Global Change and Institute for Geophysics, Astrophysics, and Meteorology, University of Graz, Graz, Austria)

Received 26 June 2009; accepted 26 August 2009; published 22 September 2009. 

Abstract

Existing upper air records of radiosonde and operational satellite data recently showed a reconciliation of temperature trends but structural uncertainties remain. GPS radio occultation (RO) provides a new high-quality record, profiling the upper troposphere and lower stratosphere with stability and homogeneity. Here we show that climate trends are since recently detected by RO data, consistent with earliest detection times estimated by simulations. Based on a temperature change detection study using the RO record within 1995–2008 we found a significant cooling trend in the tropical lower stratosphere in February while in the upper troposphere an emerging warming trend is obscured by El Niño variability. The observed trends and warming/cooling contrast across the tropopause agree well with radiosonde data and basically with climate model simulations, the latter tentatively showing less contrast. The performance of the short RO record to date underpins its capability to become a climate benchmark record in the future.

Steiner, A. K., G. Kirchengast, B. C. Lackner, B. Pirscher, M. Borsche & U. Foelsche (2009), Atmospheric temperature change detection with GPS radio occultation 1995 to 2008, Geophys. Res. Lett., 36, L18702; doi: 10.1029/2009GL039777.

Marco Tedesco & Andrew J. Monaghan, GRL (2009): An updated Antarctic melt record through 2009 and its linkages to high-latitude and tropical climate variability

Geophysical Research Letters, 36 (2009) L18502; doi: 10.1029/2009GL039186.

An updated Antarctic melt record through 2009 and its linkages to high-latitude and tropical climate variability

Marco Tedesco (Earth and Atmospheric Sciences, City College of New York, New York, NY, U.S.A.) and Andrew J. Monaghan (National Center for Atmospheric Research, Boulder, CO, U.S.A.)

Received 13 May 2009; accepted 12 August 2009; published 24 September 2009. 

Abstract

A 30-year minimum Antarctic snowmelt record occurred during austral summer 2008–2009 according to spaceborne microwave observations for 1980–2009. Strong positive phases of both the El-Niño Southern Oscillation (ENSO) and the Southern Hemisphere Annular Mode (SAM) were recorded during the months leading up to and including the 2008–2009 melt season. The 30-year record confirms that significant negative correlations exist at regional and continental scales between austral summer melting and both the ENSO and SAM indices for October–January. In particular, the strongest negative melting anomalies (such as those in 2008 and 2009) are related to amplified large-scale atmospheric forcing when both the SAM and ENSO are in positive phases. Our results suggest that enhanced snowmelt is likely to occur if recent positive summer SAM trends subside in conjunction with the projected recovery of stratospheric ozone levels, with subsequent impacts on ice sheet mass balance and sea level trends.

Tedesco, M., & A. J. Monaghan (2009), An updated Antarctic melt record through 2009 and its linkages to high-latitude and tropical climate variability, Geophys. Res. Lett., 36, L18502; doi: 10.1029/2009GL039186.

Link to abstract:  http://www.agu.org/pubs/crossref/2009/2009GL039186.shtml

World's Oceans Set Temperature Record

Discovery News: World's oceans set temperature record

by Seth Borenstein, Associated Press

Aug. 20, 2009 -- July marked the hottest the world's oceans have been in almost 130 years of record-keeping. Meteorologists said a combination of forces are at work: A natural El Nino system on top of worsening man-made global warming and a dash of random weather variations.

The resulting ocean heat is already harming threatened coral reefs. It could also hasten the melting of Arctic sea ice and help hurricanes strengthen.

The average water temperature worldwide in July was 62.6 °F, according to the National Climatic Data Center, the branch of the U.S. government that keeps world weather records.

June was only slightly cooler, while August could set another record, scientists said.

The previous record was set in July 1998 during a powerful El Nino weather pattern.

The Gulf of Mexico, where warm water fuels hurricanes, has temperatures dancing around 90. Most of the water in the Northern Hemisphere has been considerably warmer than normal. The Mediterranean is about three degrees warmer than normal. Higher temperatures rule in the Pacific and Indian Oceans.

The heat is most noticeable near the Arctic, where water temperatures are as much as 10 °F above average. The tongues of warm water could help melt sea ice from below and even cause thawing of ice sheets on Greenland, said Waleed Abdalati, director of the Earth Science and Observation Center at the University of Colorado.

Breaking heat records in water is more ominous as a sign of global warming than breaking temperature marks on land, because water takes longer to heat up and does not cool off as easily as land.

"This warm water we're seeing doesn't just disappear next year; it'll be around for a long time," said climate scientist Andrew Weaver of the University of Victoria in British Columbia. It takes five times more energy to warm water than land.

The warmer water "affects weather on the land," Weaver said. "This is another yet really important indicator of the change that's occurring."

Georgia Institute of Technology atmospheric science professor Judith Curry said water is warming in more places than usual, something that has not been seen in more than 50 years.

Add to that an unusual weather pattern this summer where the warmest temperatures seem to be just over oceans, while slightly cooler air is concentrated over land, said Deke Arndt, head of climate monitoring at the climate data center.

The pattern is so unusual that he suggested meteorologists may want to study that pattern to see what's behind it.

The effects of that warm water are already being seen in coral reefs, said C. Mark Eakin, coordinator of the National Oceanic and Atmospheric Administration's coral reef watch. Long-term excessive heat bleaches colorful coral reefs white and sometimes kills them.

Bleaching has started to crop up in the Florida Keys, Puerto Rico and the Virgin Islands -- much earlier than usual. Typically, bleaching occurs after weeks or months of prolonged high water temperatures. That usually means September or October in the Caribbean, said Eakin. He found bleaching in Guam Wednesday. It's too early to know if the coral will recover or die. Experts are "bracing for another bad year," he said.

The problems caused by the El Nino pattern are likely to get worse, the scientists said.

An El Nino occurs when part of the central Pacific warms up, which in turn changes weather patterns worldwide for many months. El Nino and its cooling flip side, La Nina, happen every few years.

During an El Nino, temperatures on water and land tend to rise in many places, leading to an increase in the overall global average temperature. An El Nino has other effects, too, including dampening Atlantic hurricane formation and increasing rainfall and mudslides in Southern California.

Warm water is a required fuel for hurricanes. What's happening in the oceans "will add extra juice to the hurricanes," Curry said.

Hurricane activity has been quiet for much of the summer, but that may change soon, she said. Hurricane Bill quickly became a major storm and the National Hurricane Center warned that warm waters are along the path of the hurricane for the next few days.

Hurricanes need specific air conditions, so warmer water alone does not necessarily mean more or bigger storms, said James Franklin, chief hurricane specialist at the National Hurricane Center in Miami.

Link: http://dsc.discovery.com/news/2009/08/20/ocean-temperature.html

J. L. Lean & D. H. Rind, GRL, 36 (2009): How will Earth's surface temperature change in future decades?

Geophysical Research Letters, 36 (2009) L15708; doi: 10.1029/2009GL038932

How will Earth's surface temperature change in future decades?

Judith L. Lean (Space Science Division, Naval Research Laboratory, Washington, DC, U.S.A.) and David H. Rind (NASA Goddard Institute for Space Studies, New York, NY, U.S.A.)

Abstract

Reliable forecasts of climate change in the immediate future are difficult, especially on regional scales, where natural climate variations may amplify or mitigate anthropogenic warming in ways that numerical models capture poorly. By decomposing recent observed surface temperatures into components associated with ENSO, volcanic and solar activity, and anthropogenic influences, we anticipate global and regional changes in the next two decades. From 2009 to 2014, projected rises in anthropogenic influences and solar irradiance will increase global surface temperature 0.15 ± 0.03 °C, at a rate 50% greater than predicted by IPCC. But as a result of declining solar activity in the subsequent five years, average temperature in 2019 is only 0.03 ± 0.01° C warmer than in 2014. This lack of overall warming is analogous to the period from 2002 to 2008 when decreasing solar irradiance also countered much of the anthropogenic warming. We further illustrate how a major volcanic eruption and a super ENSO would modify our global and regional temperature projections.

(Received 29 April 2009, accepted 9 July 2009, published 15 August 2009.)

Lean, J. L., & D. H. Rind (2009), How will Earth's surface temperature change in future decades?, Geophysical Research Letters, 36, L15708; doi: 10.1029/2009GL038932.

Link to abstract: http://www.agu.org/pubs/crossref/2009/2009GL038932.shtml

Seth Borenstein, Assoc. Press: World's Oceans Set Temperature Record

World's Oceans Set Temperature Record

by Seth Borenstein, Associated Press, August 20, 2009

Record Highs
Record Highs | Discovery News Video

Aug. 20, 2009 -- July marked the hottest the world's oceans have been in almost 130 years of record-keeping. Meteorologists said a combination of forces are at work: A natural El Nino

system on top of worsening man-made global warming and a dash of random weather variations.

The resulting ocean heat is already harming threatened coral reefs. It could also hasten the melting of Arctic sea ice and help hurricanes strengthen.

The average water temperature worldwide in July was 62.6 degrees, according to the National Climatic Data Center, the branch of the U.S. government that keeps world weather records.

June was only slightly cooler, while August could set another record, scientists said.

The previous record was set in July 1998 during a powerful El Nino weather pattern.

Related Content:

The Gulf of Mexico, where warm water fuels hurricanes, has temperatures dancing around 90. Most of the water in the Northern Hemisphere has been considerably warmer than normal. The Mediterranean is about three degrees warmer than normal. Higher temperatures rule in the Pacific and Indian Oceans.

The heat is most noticeable near the Arctic, where water temperatures are as much as 10 degrees above average. The tongues of warm water could help melt sea ice from below and even cause thawing of ice sheets on Greenland, said Waleed Abdalati, director of the Earth Science and Observation Center at the University of Colorado.

Breaking heat records in water is more ominous as a sign of global warming than breaking temperature marks on land, because water takes longer to heat up and does not cool off as easily as land.

"This warm water we're seeing doesn't just disappear next year; it'll be around for a long time," said climate scientist Andrew Weaver of the University of Victoria in British Columbia. It takes five times more energy to warm water than land.

The warmer water "affects weather on the land," Weaver said. "This is another yet really important indicator of the change that's occurring."

Georgia Institute of Technology atmospheric science professor Judith Curry said water is warming in more places than usual, something that has not been seen in more than 50 years.

Add to that an unusual weather pattern this summer where the warmest temperatures seem to be just over oceans, while slightly cooler air is concentrated over land, said Deke Arndt, head of climate monitoring at the climate data center.

The pattern is so unusual that he suggested meteorologists may want to study that pattern to see what's behind it.

The effects of that warm water are already being seen in coral reefs, said C. Mark Eakin, coordinator of the National Oceanic and Atmospheric Administration's coral reef watch. Long-term excessive heat bleaches colorful coral reefs white and sometimes kills them.

Bleaching has started to crop up in the Florida Keys, Puerto Rico and the Virgin Islands -- much earlier than usual. Typically, bleaching occurs after weeks or months of prolonged high water temperatures. That usually means September or October in the Caribbean, said Eakin. He found bleaching in Guam, Wednesday. It's too early to know if the coral will recover or die. Experts are "bracing for another bad year," he said.

The problems caused by the El Nino pattern are likely to get worse, the scientists said.

An El Nino occurs when part of the central Pacific warms up, which in turn changes weather patterns worldwide for many months. El Nino and its cooling flip side, La Nina, happen every few years.

During an El Nino, temperatures on water and land tend to rise in many places, leading to an increase in the overall global average temperature. An El Nino has other effects, too, including dampening Atlantic hurricane formation and increasing rainfall and mudslides in Southern California.

Warm water is a required fuel for hurricanes. What's happening in the oceans "will add extra juice to the hurricanes," Curry said.

Hurricane activity has been quiet for much of the summer, but that may change soon, she said. Hurricane Bill quickly became a major storm and the National Hurricane Center warned that warm waters are along the path of the hurricane for the next few days.

Hurricanes need specific air conditions, so warmer water alone does not necessarily mean more or bigger storms, said James Franklin, chief hurricane specialist at the National Hurricane Center in Miami.

Link: http://dsc.discovery.com/news/2009/08/20/ocean-temperature.html